1. Met Data Explorer (MDE)
1.1. Introduction
In recent years, there has been a growing recognition of the need for standardized ways of sharing meteorological gridded data on the web. In response to this need, Unidata, a division of the University Corporation for Atmospheric Research (UCAR) developed the THREDDS Data Server (TDS). TDS is a web server that provides metadata and data access for scientific datasets, using OPeNDAP, OGC WMS and WCS, HTTP, and other remote data access protocols.
In order to extract data from the TDS, many tools were developed such as the grids python package. The grids package allows for extracting time series subsets from n-dimensional arrays in NetCDF, GRIB, HDF, and GeoTIFF formats. Met Data Explorer (MDE) is a newly developed web-based tool allowing a broad range of users to discover, access, visualize, and download data from any TDS that stores available meteorological data using the grids package. MDE was also designed in a way that allows users to customize it for local or regional web portals.
1.2. MDE Overview
MDE is an open-source web application providing users with the functionalities of data discovery, data access, data visualization, and data downloading from any TDS. MDE can be installed by any organization and requires minimal server space.
The MDE is an open-source web application for visualizing meteorological gridded data. Utilizing TDS to serve the data, the application allows you to organize and save data files with the specific variables and dimensions that you need, visualize the data in a Leaflet based map viewer, animate the data across a time series, and extract a time series over a specified area. The area for extraction can be specified as a marker, bounding box, or polygons. To extract a time series, the application utilizes the grids python to remotely access and extract the data over the given area. The time series extraction feature in the MDE will work on most data, provided that the data conforms to OGC3 standards and the TDS is properly configured.
1.2.1. User Interface
MDE uses THREDDS files that are organized in Catalogs.
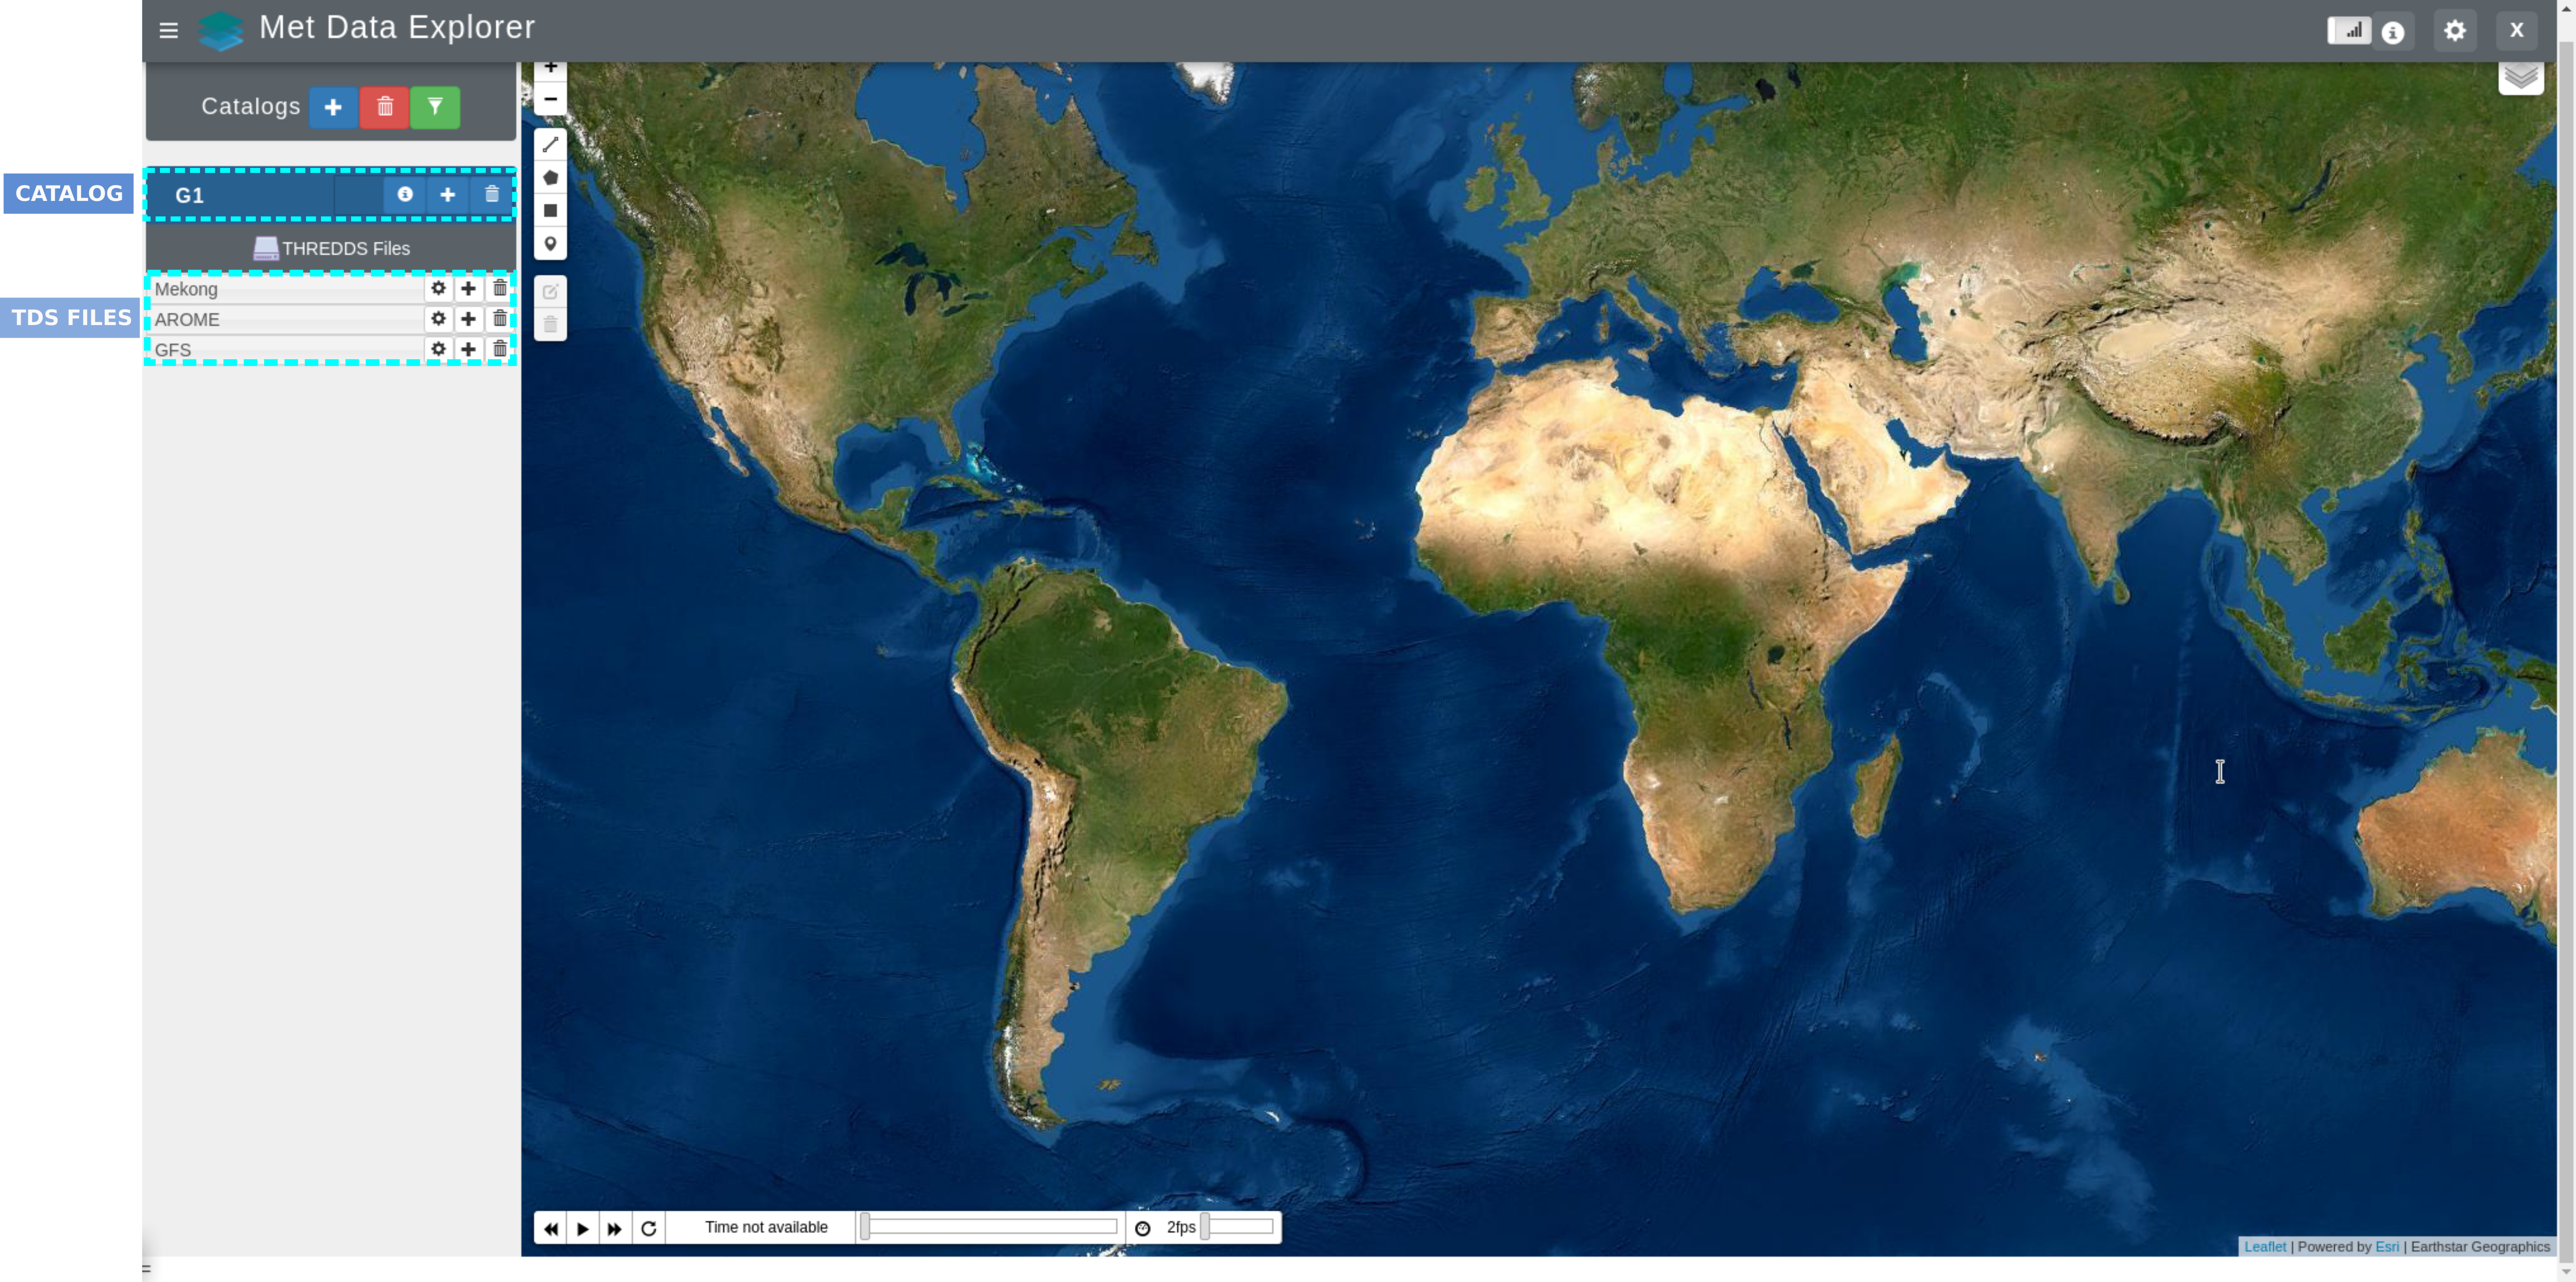
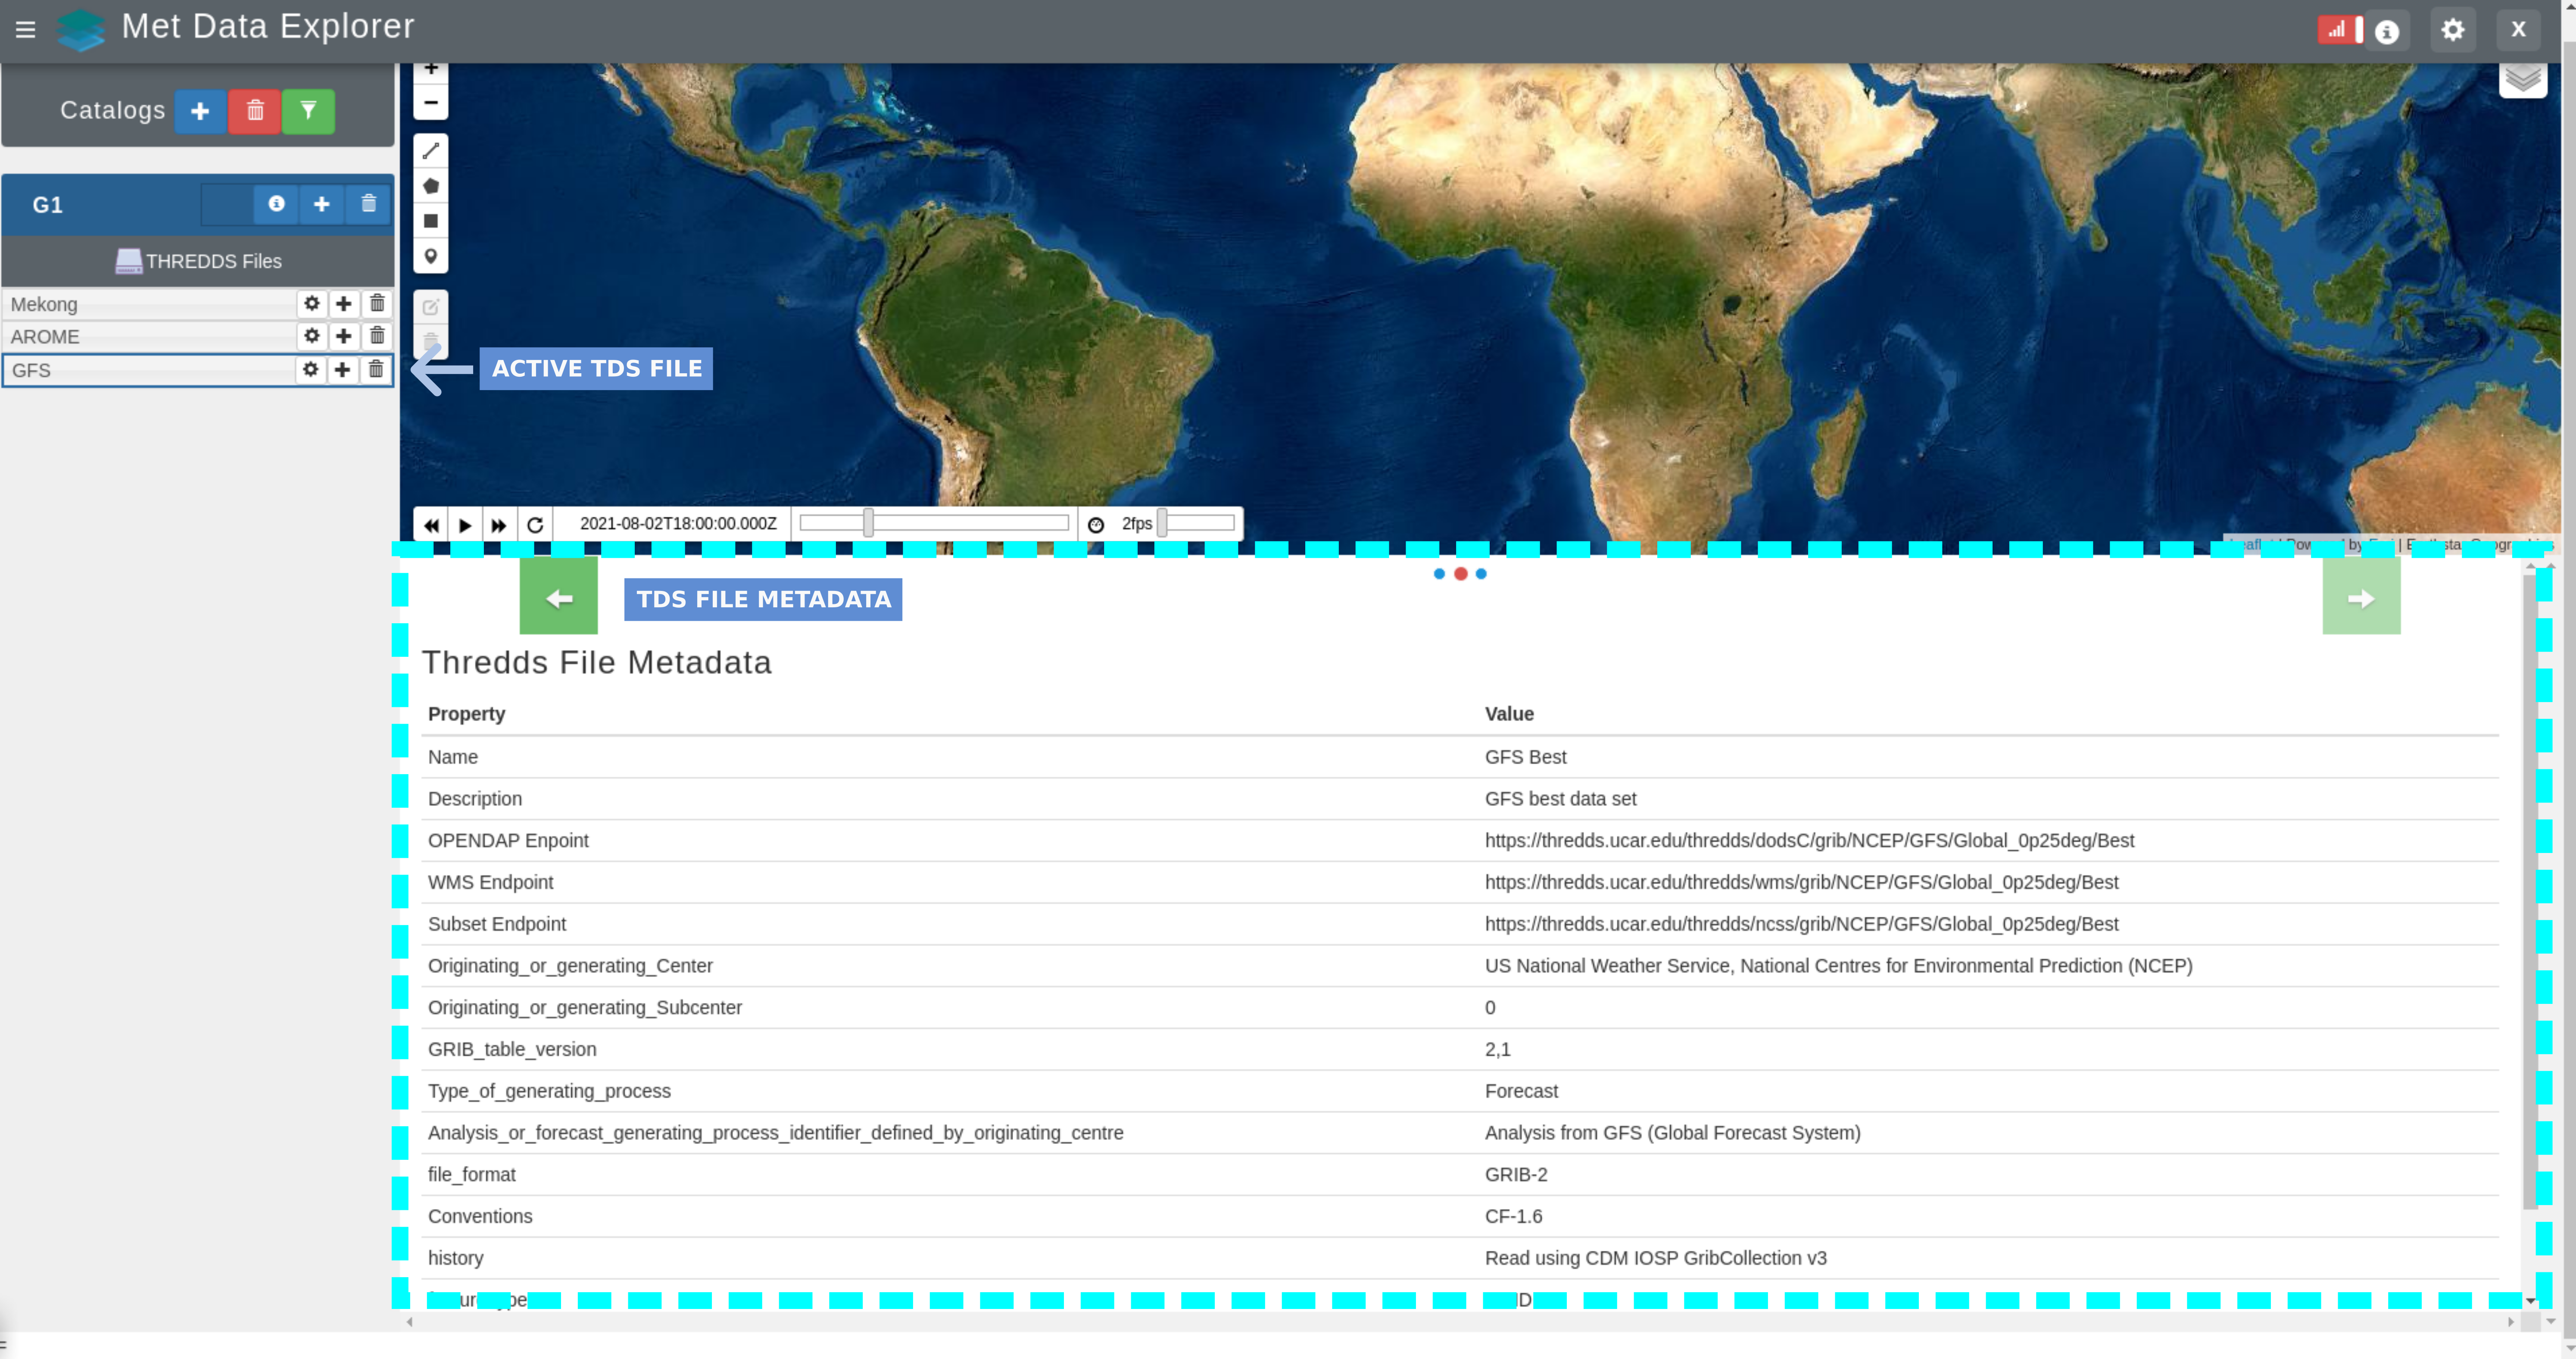
Each THREDDS file contains a set of data that is accessible through a specific OPeNDAP service.
For each THREDDS files, a set of metadata is available in the Graphs Panel of the MDE User Interface.
Also, for each THREDDS files,a table of variables is available, which includes the dimensions and metadata of each variable.
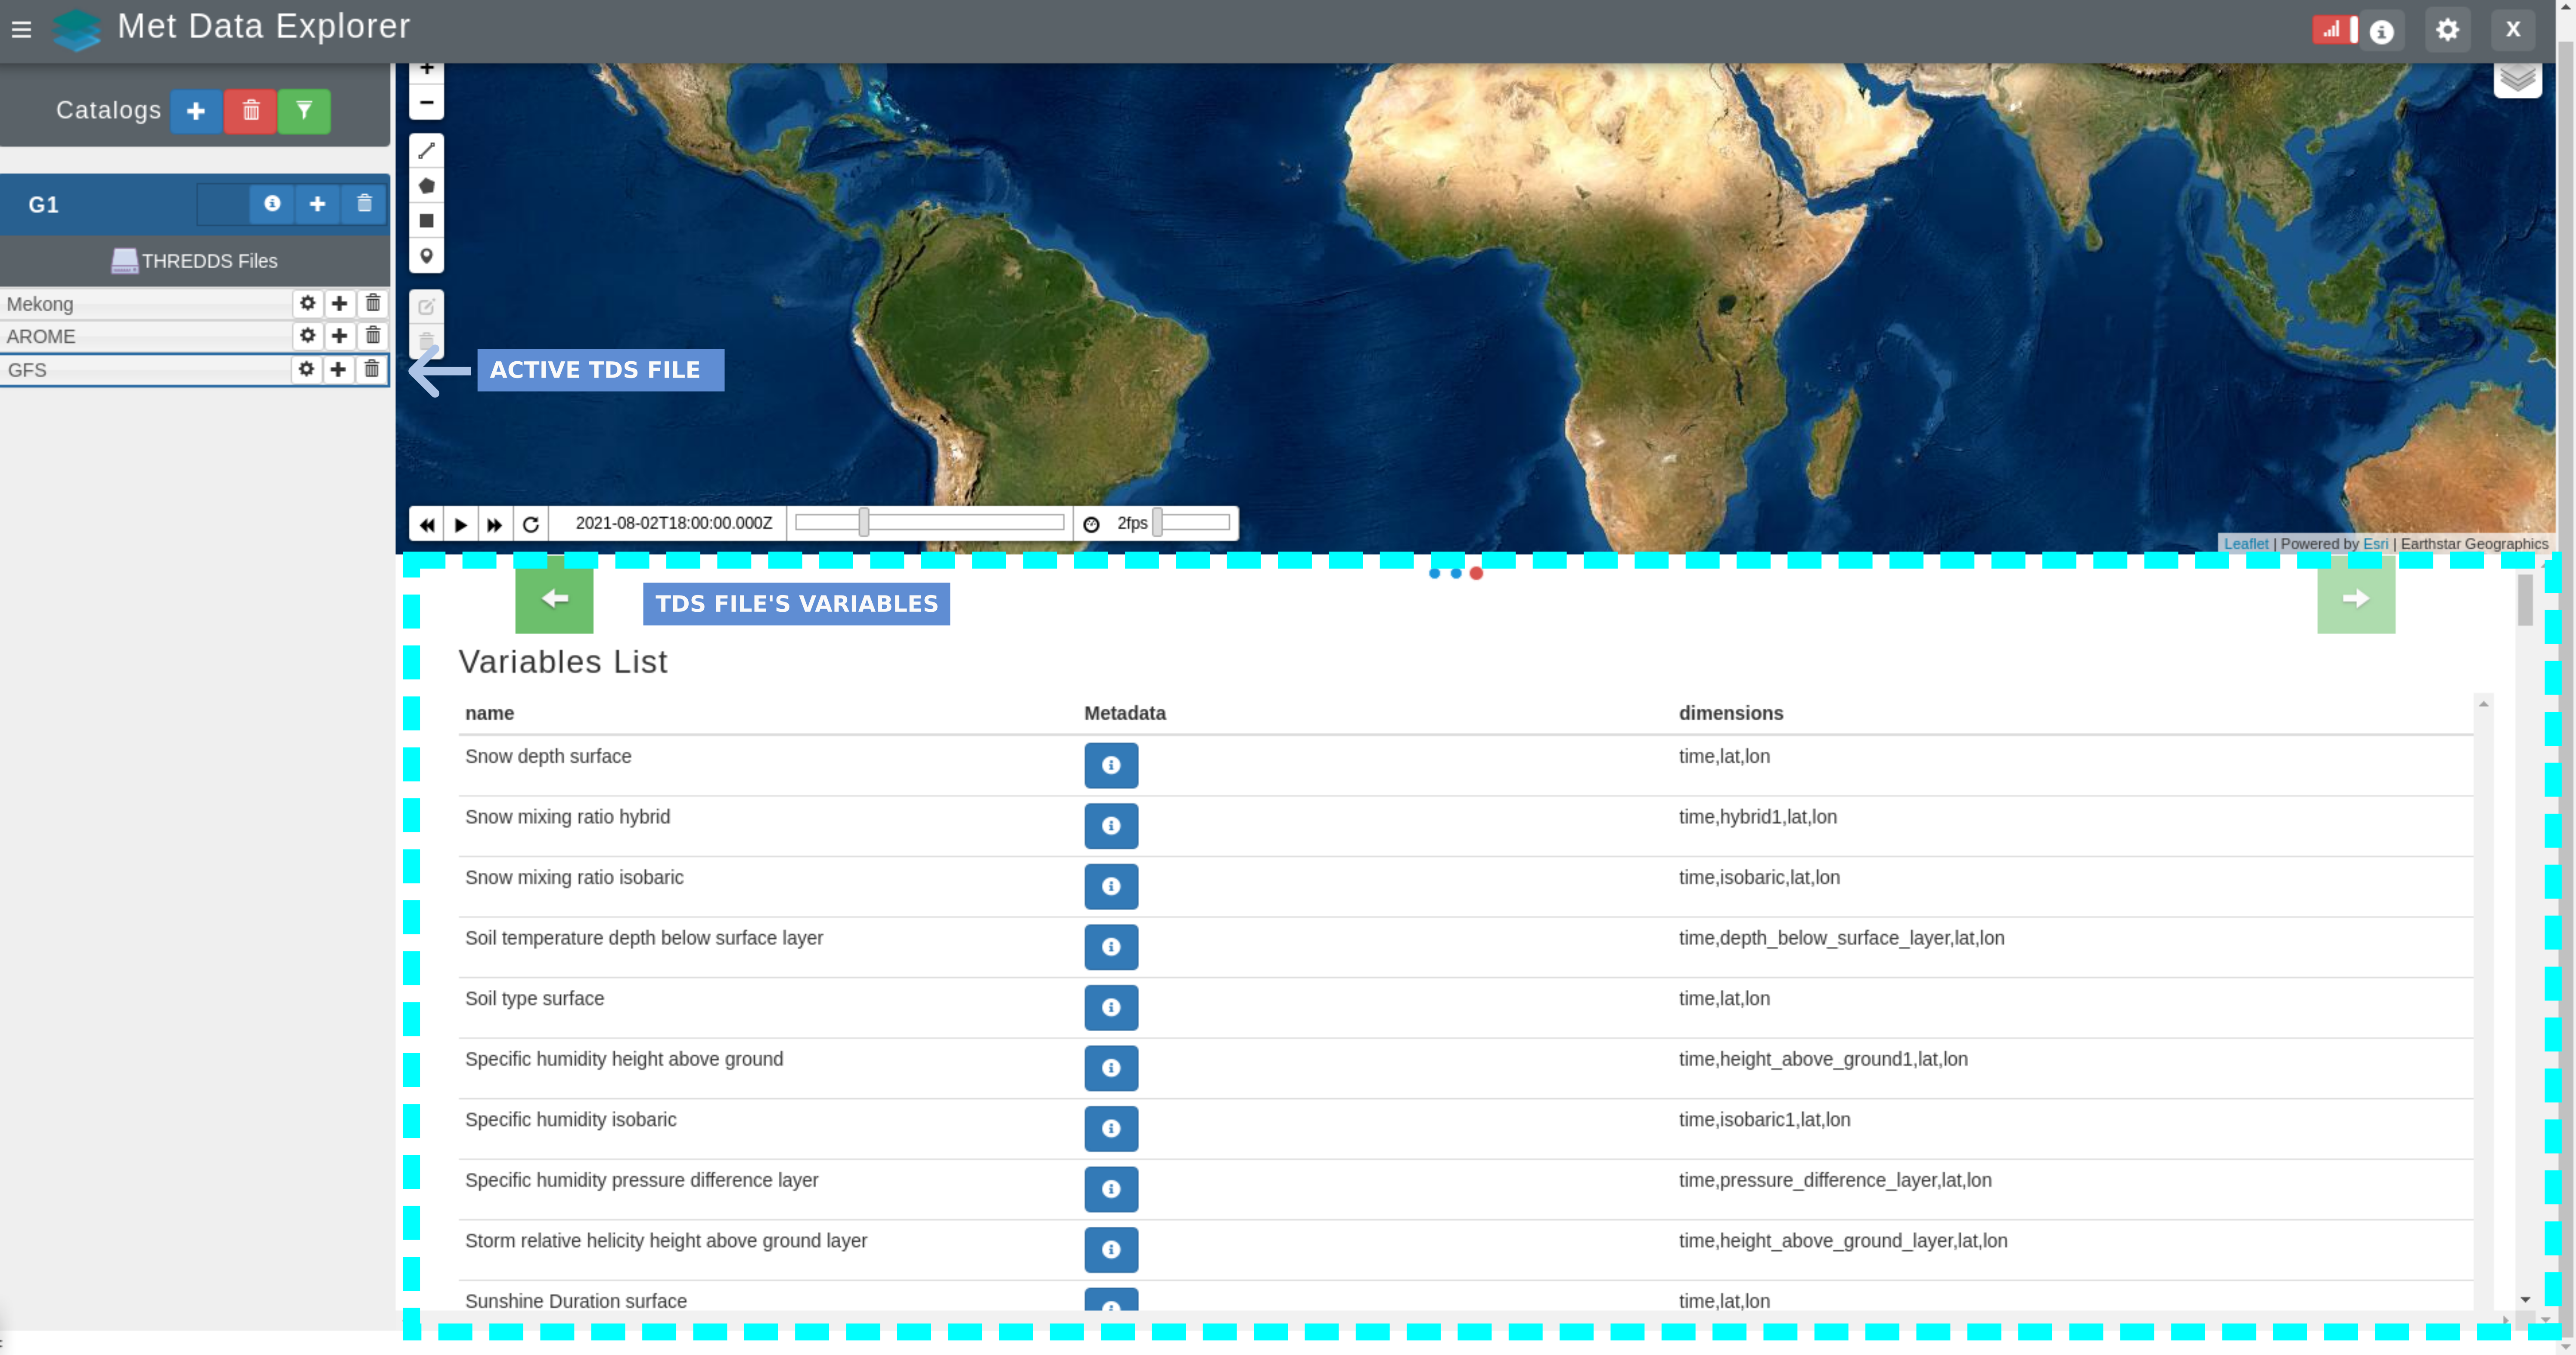
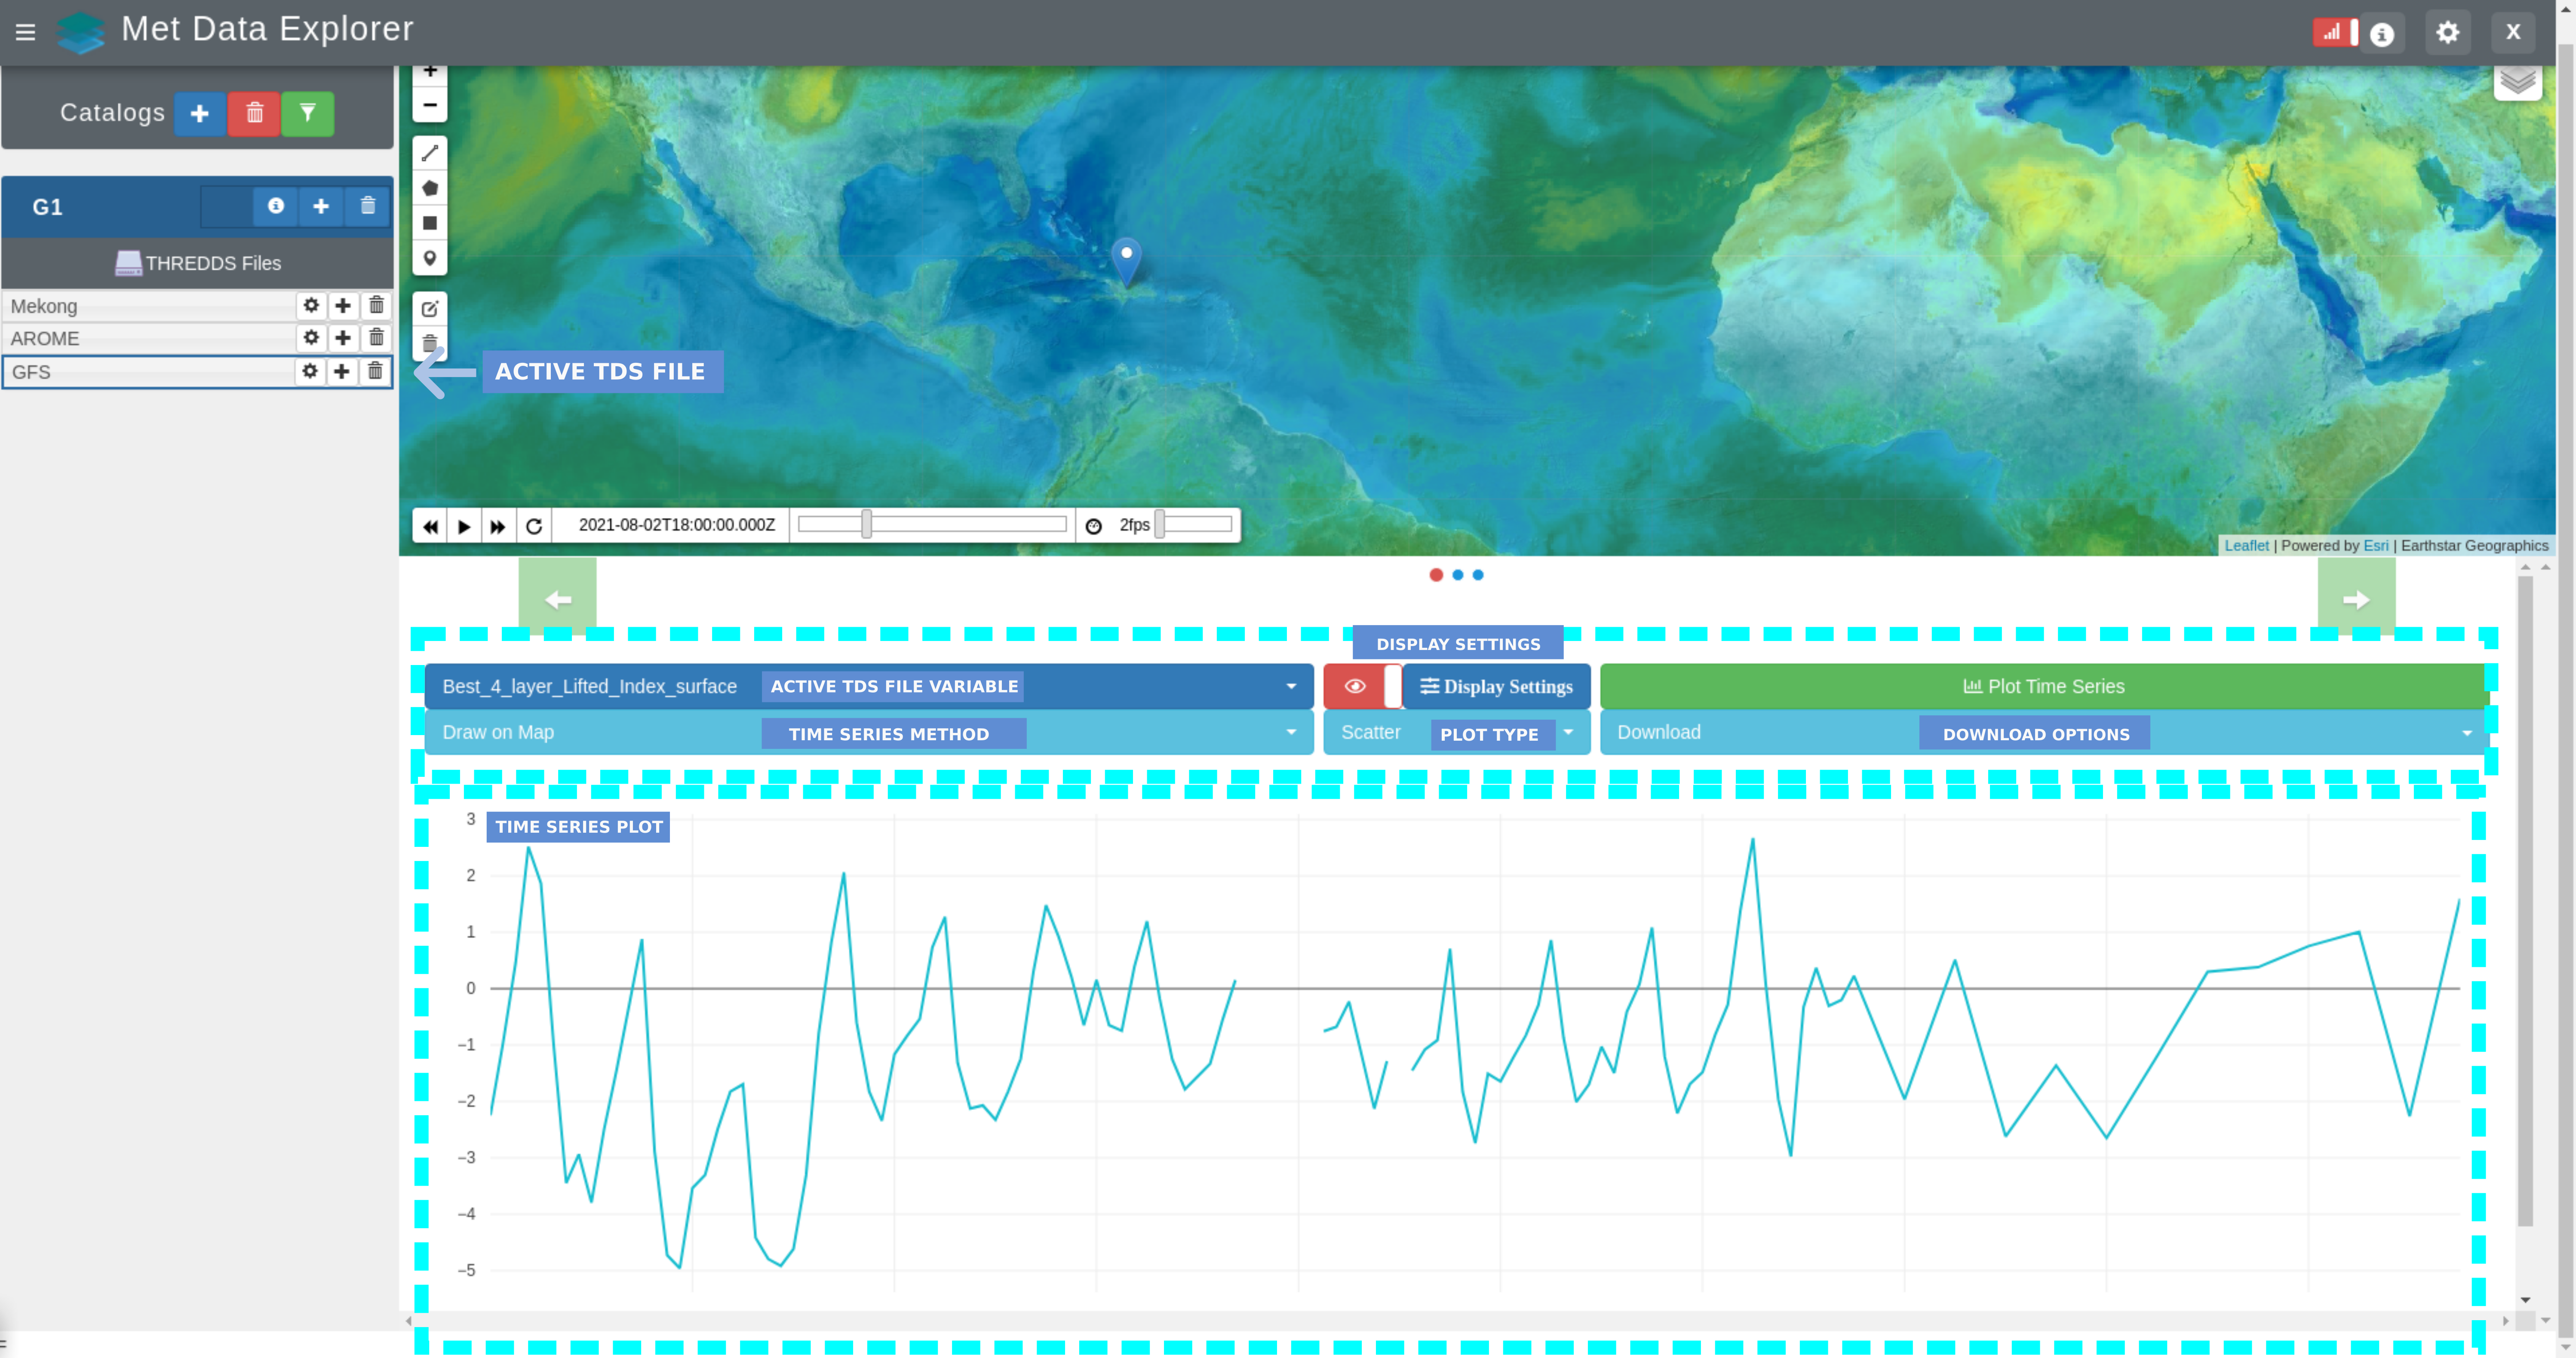
Variables are displayed on the MDE map interface using Web Mapping Services (WMS) layers.

Variables time series data can be plotted as “Scatter” or “Whisker and Box” plots, and be downloaded in CSV and JSON formats for any available time period of interest in the Time Series Plots section.
1.2.2. Developers
MDE was originally developed by Enoch Jones and later finished by Elkin Giovanni Romero Bustamante at Brigham Young University’s (BYU) Hydroinformatics laboratory with the support of the World Meteorological Organization. The BYU’s Hydroinformatics laboratory focuses on delivering different software products and services for water modelling. Some of the most important works include: Global Streamflow Forecast Services API , creation of the Tethys Platform , and Hydroserver Lite . The most recent publications and works can be found on the BYU Hydroinformatics website.
1.2.3. Source Code
The MDE source code is available on Github: