2. MDE User Functionalities
2.1. Data Discovery
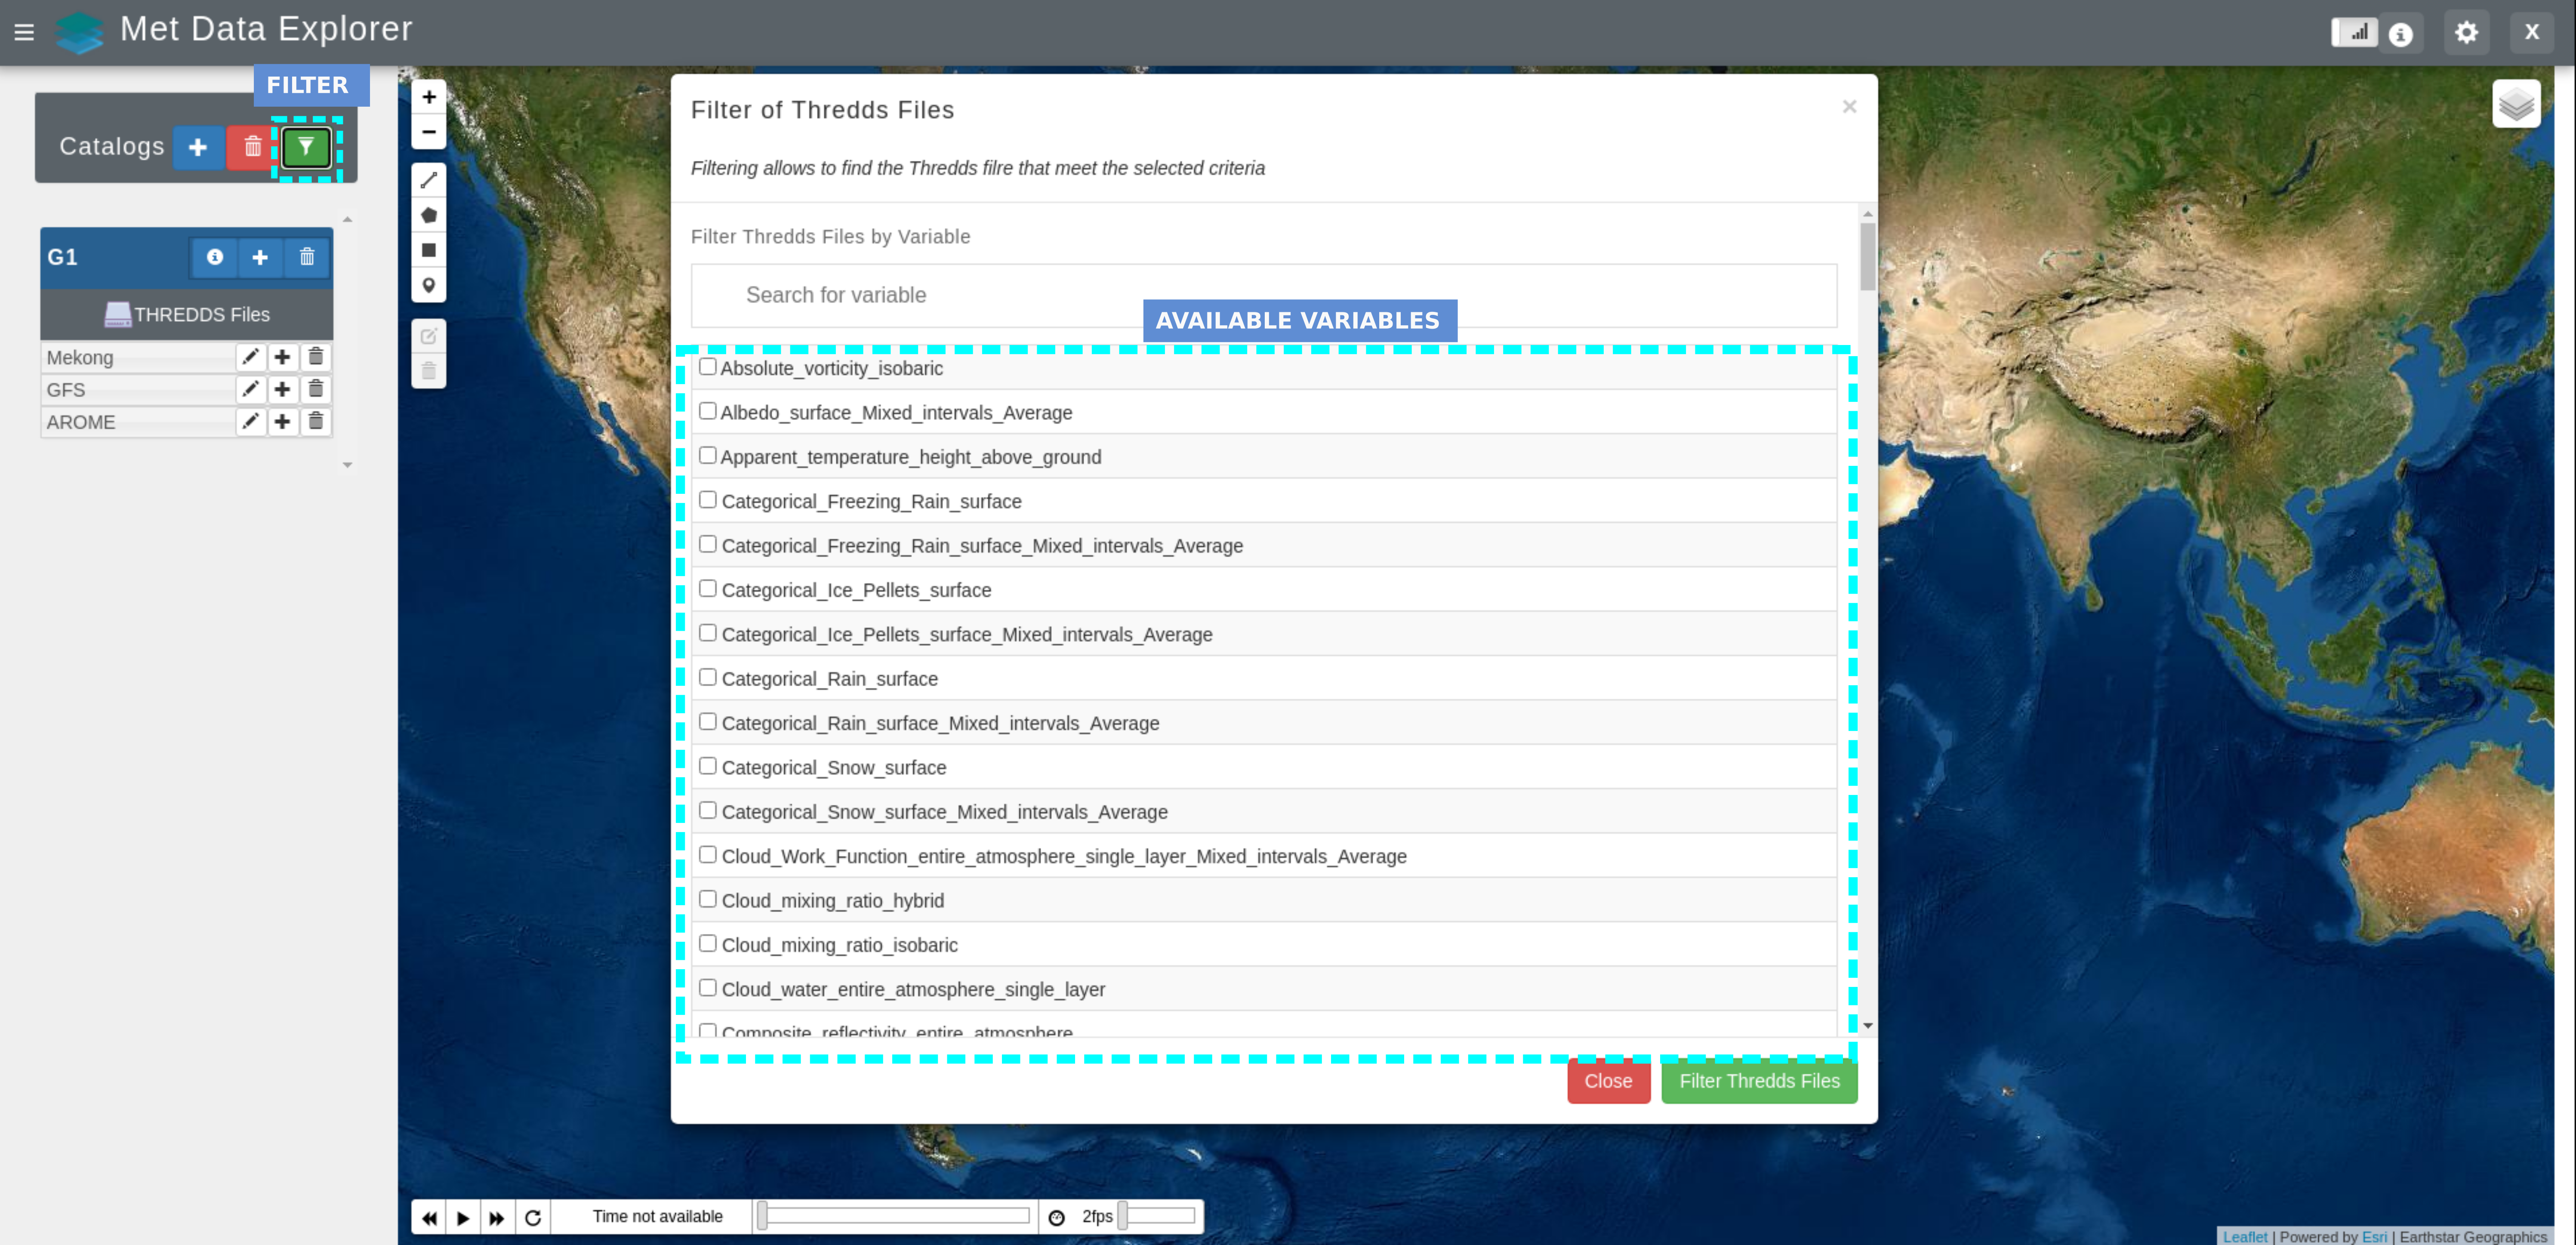
The user can filter the available TDS files by variable of interest by using the  icon.
icon.
To display the metadata related to a specific TDS file, the user should click on the TDS file title.
The graphs panel will be opened, and the first variable of the TDS file will be displayed on the map
using Web Mapping Services(WMS). The appearance of the TDS file variable can be change by pressing on the  icon.
icon.
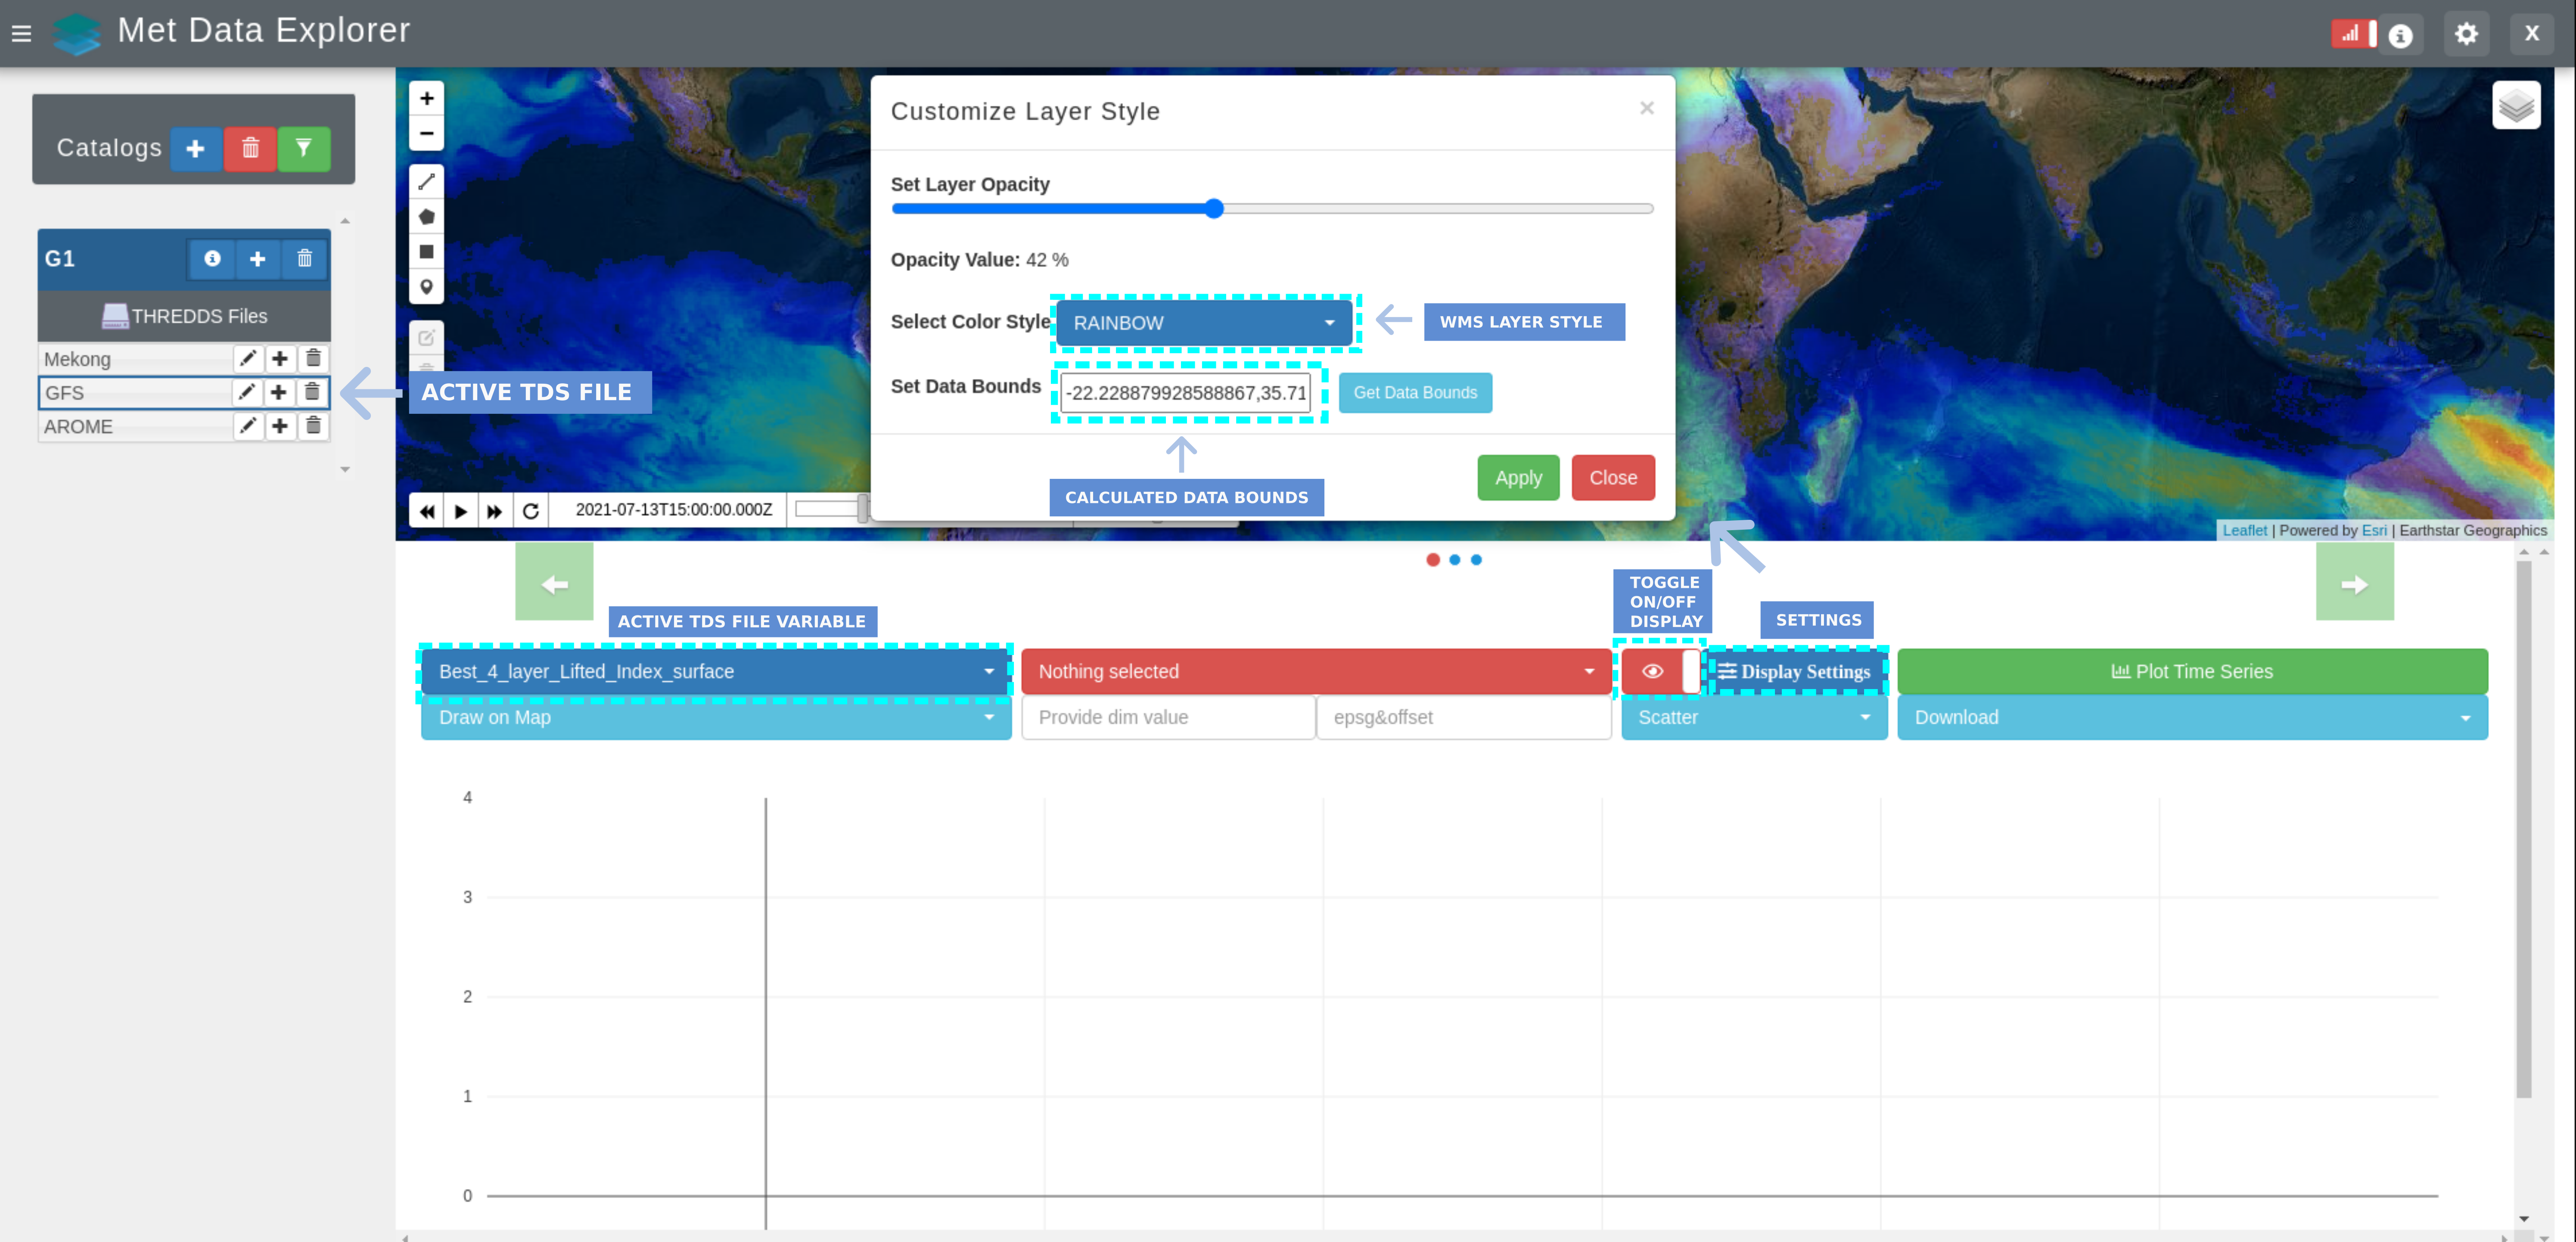
Note
The display settings allows to change the opacity and color style of the WMS layer beloging to the TDS file variable. It also allows the user to find or enter manually the data bounds of the TDS file variable.
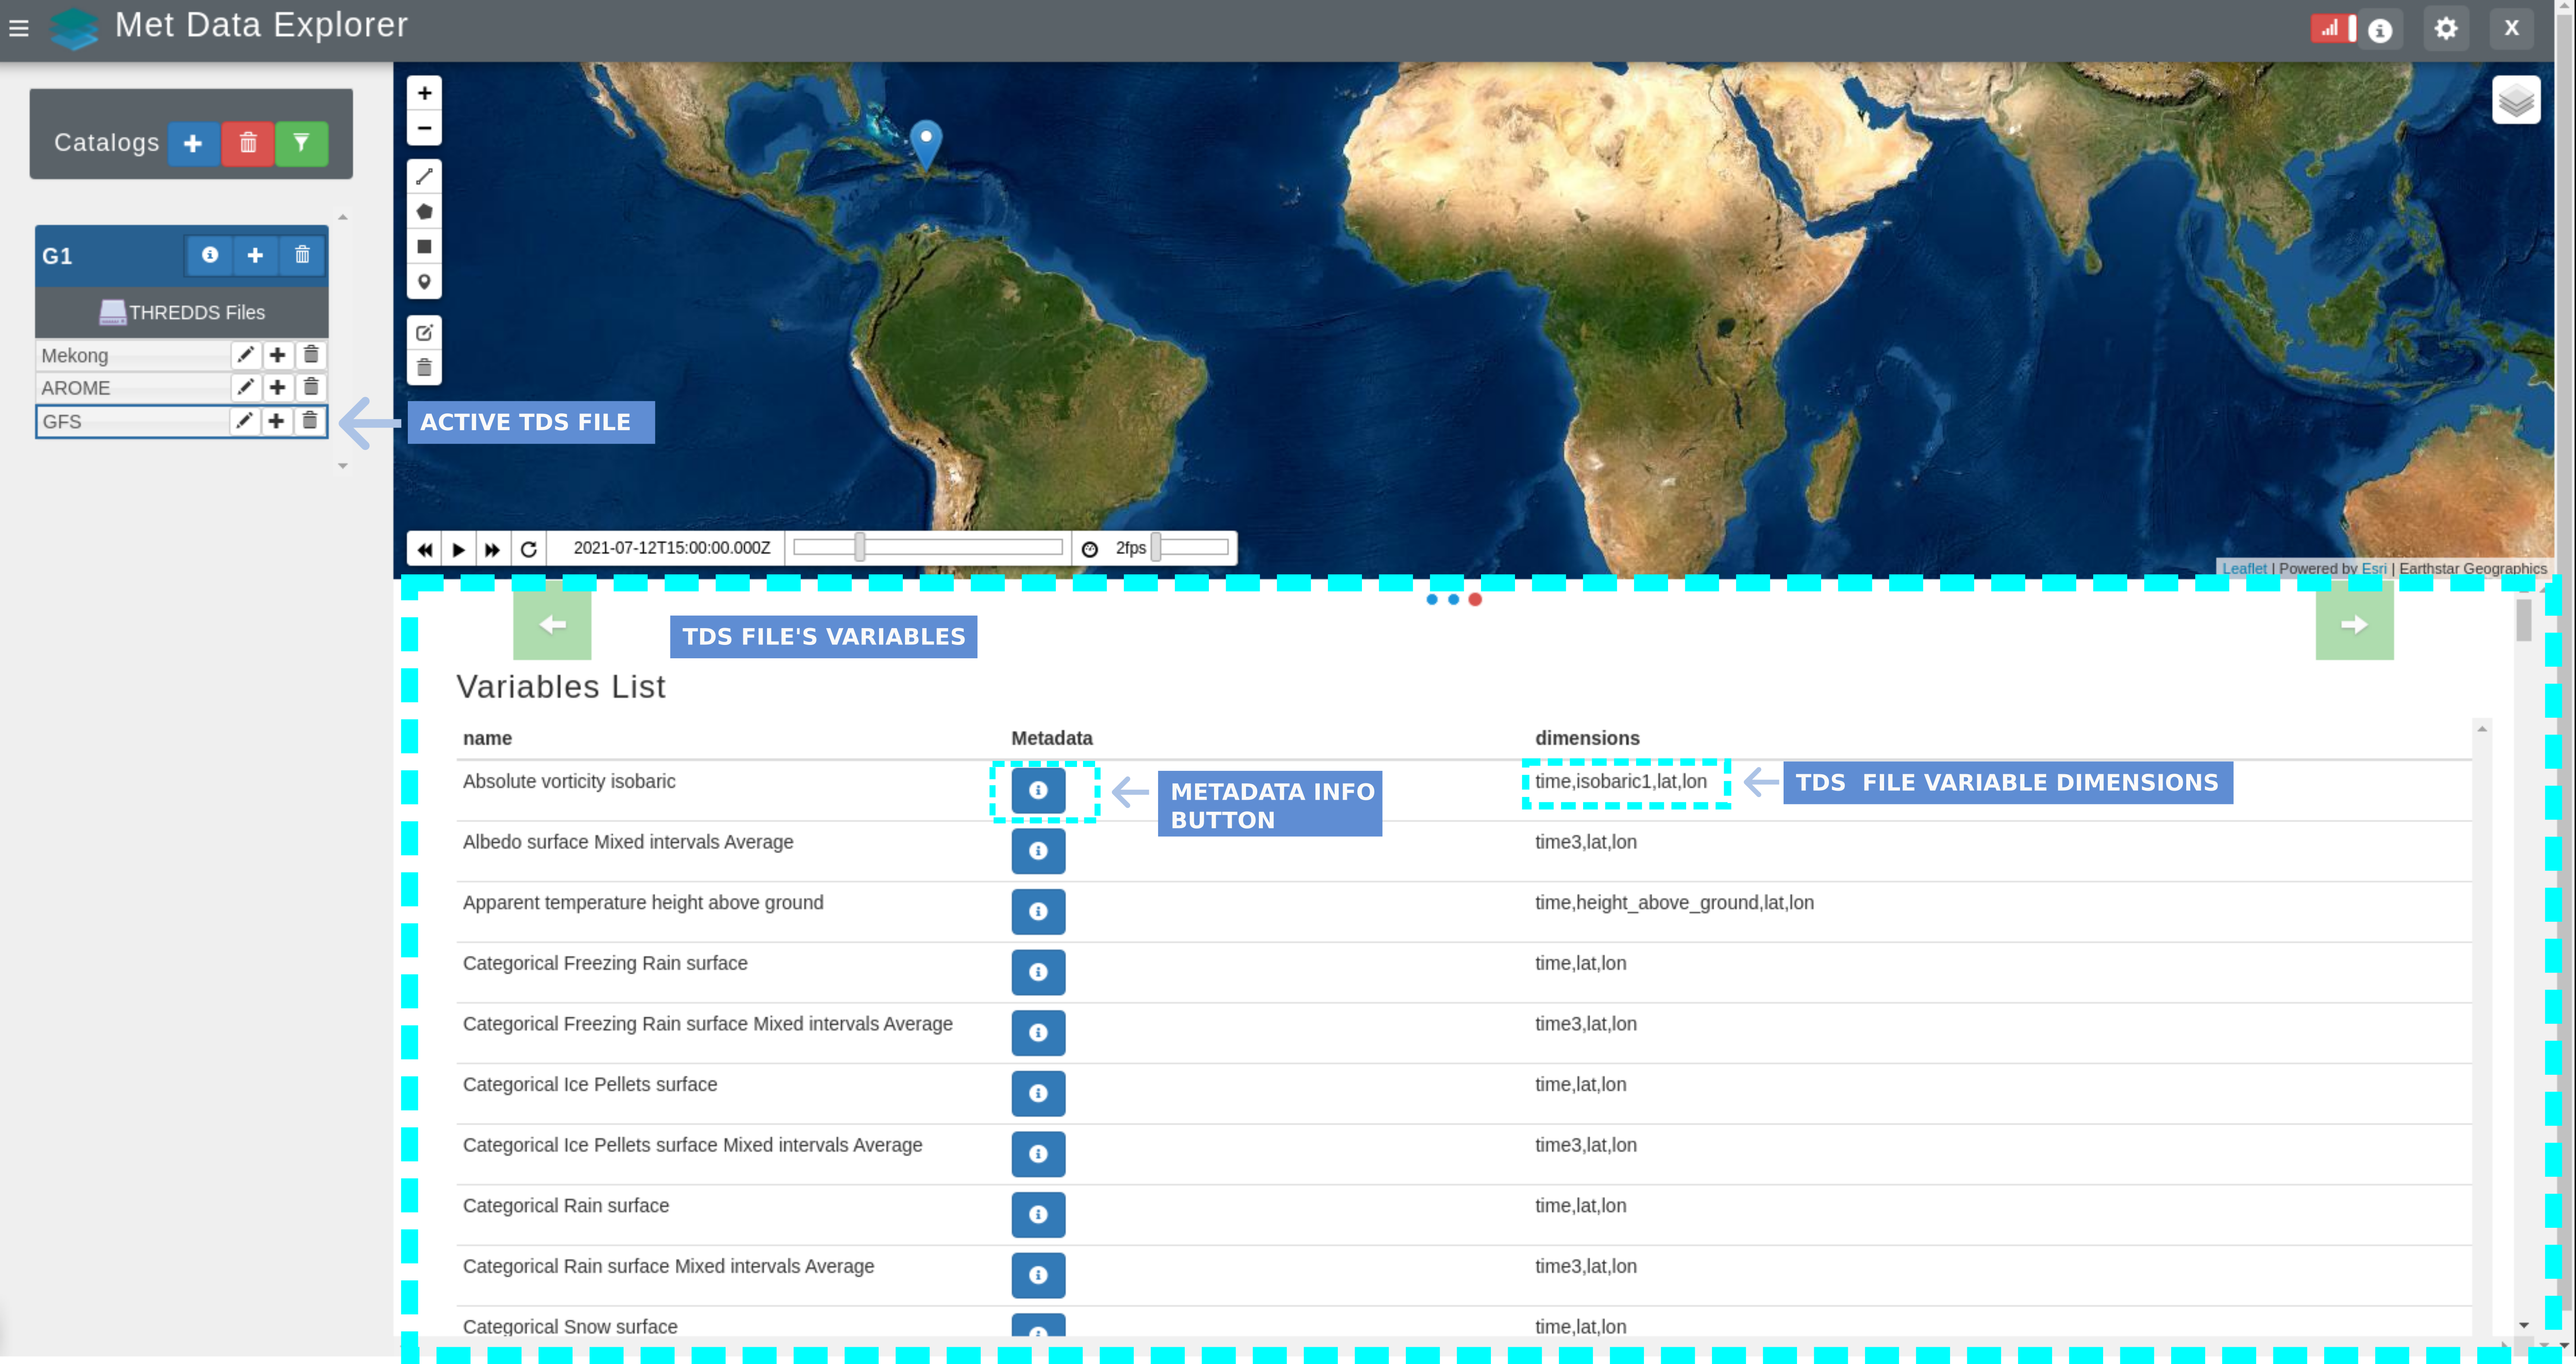
To see the available variables of the selected TDS file, the user should use the
 icon. A table displaying all the variables found in the TDS file is generated.
The table also shows the dimensions and metadata of each variable.
icon. A table displaying all the variables found in the TDS file is generated.
The table also shows the dimensions and metadata of each variable.
Note
In order to see the metadata of a variable, the user needs to press in button with the  icon.
icon.
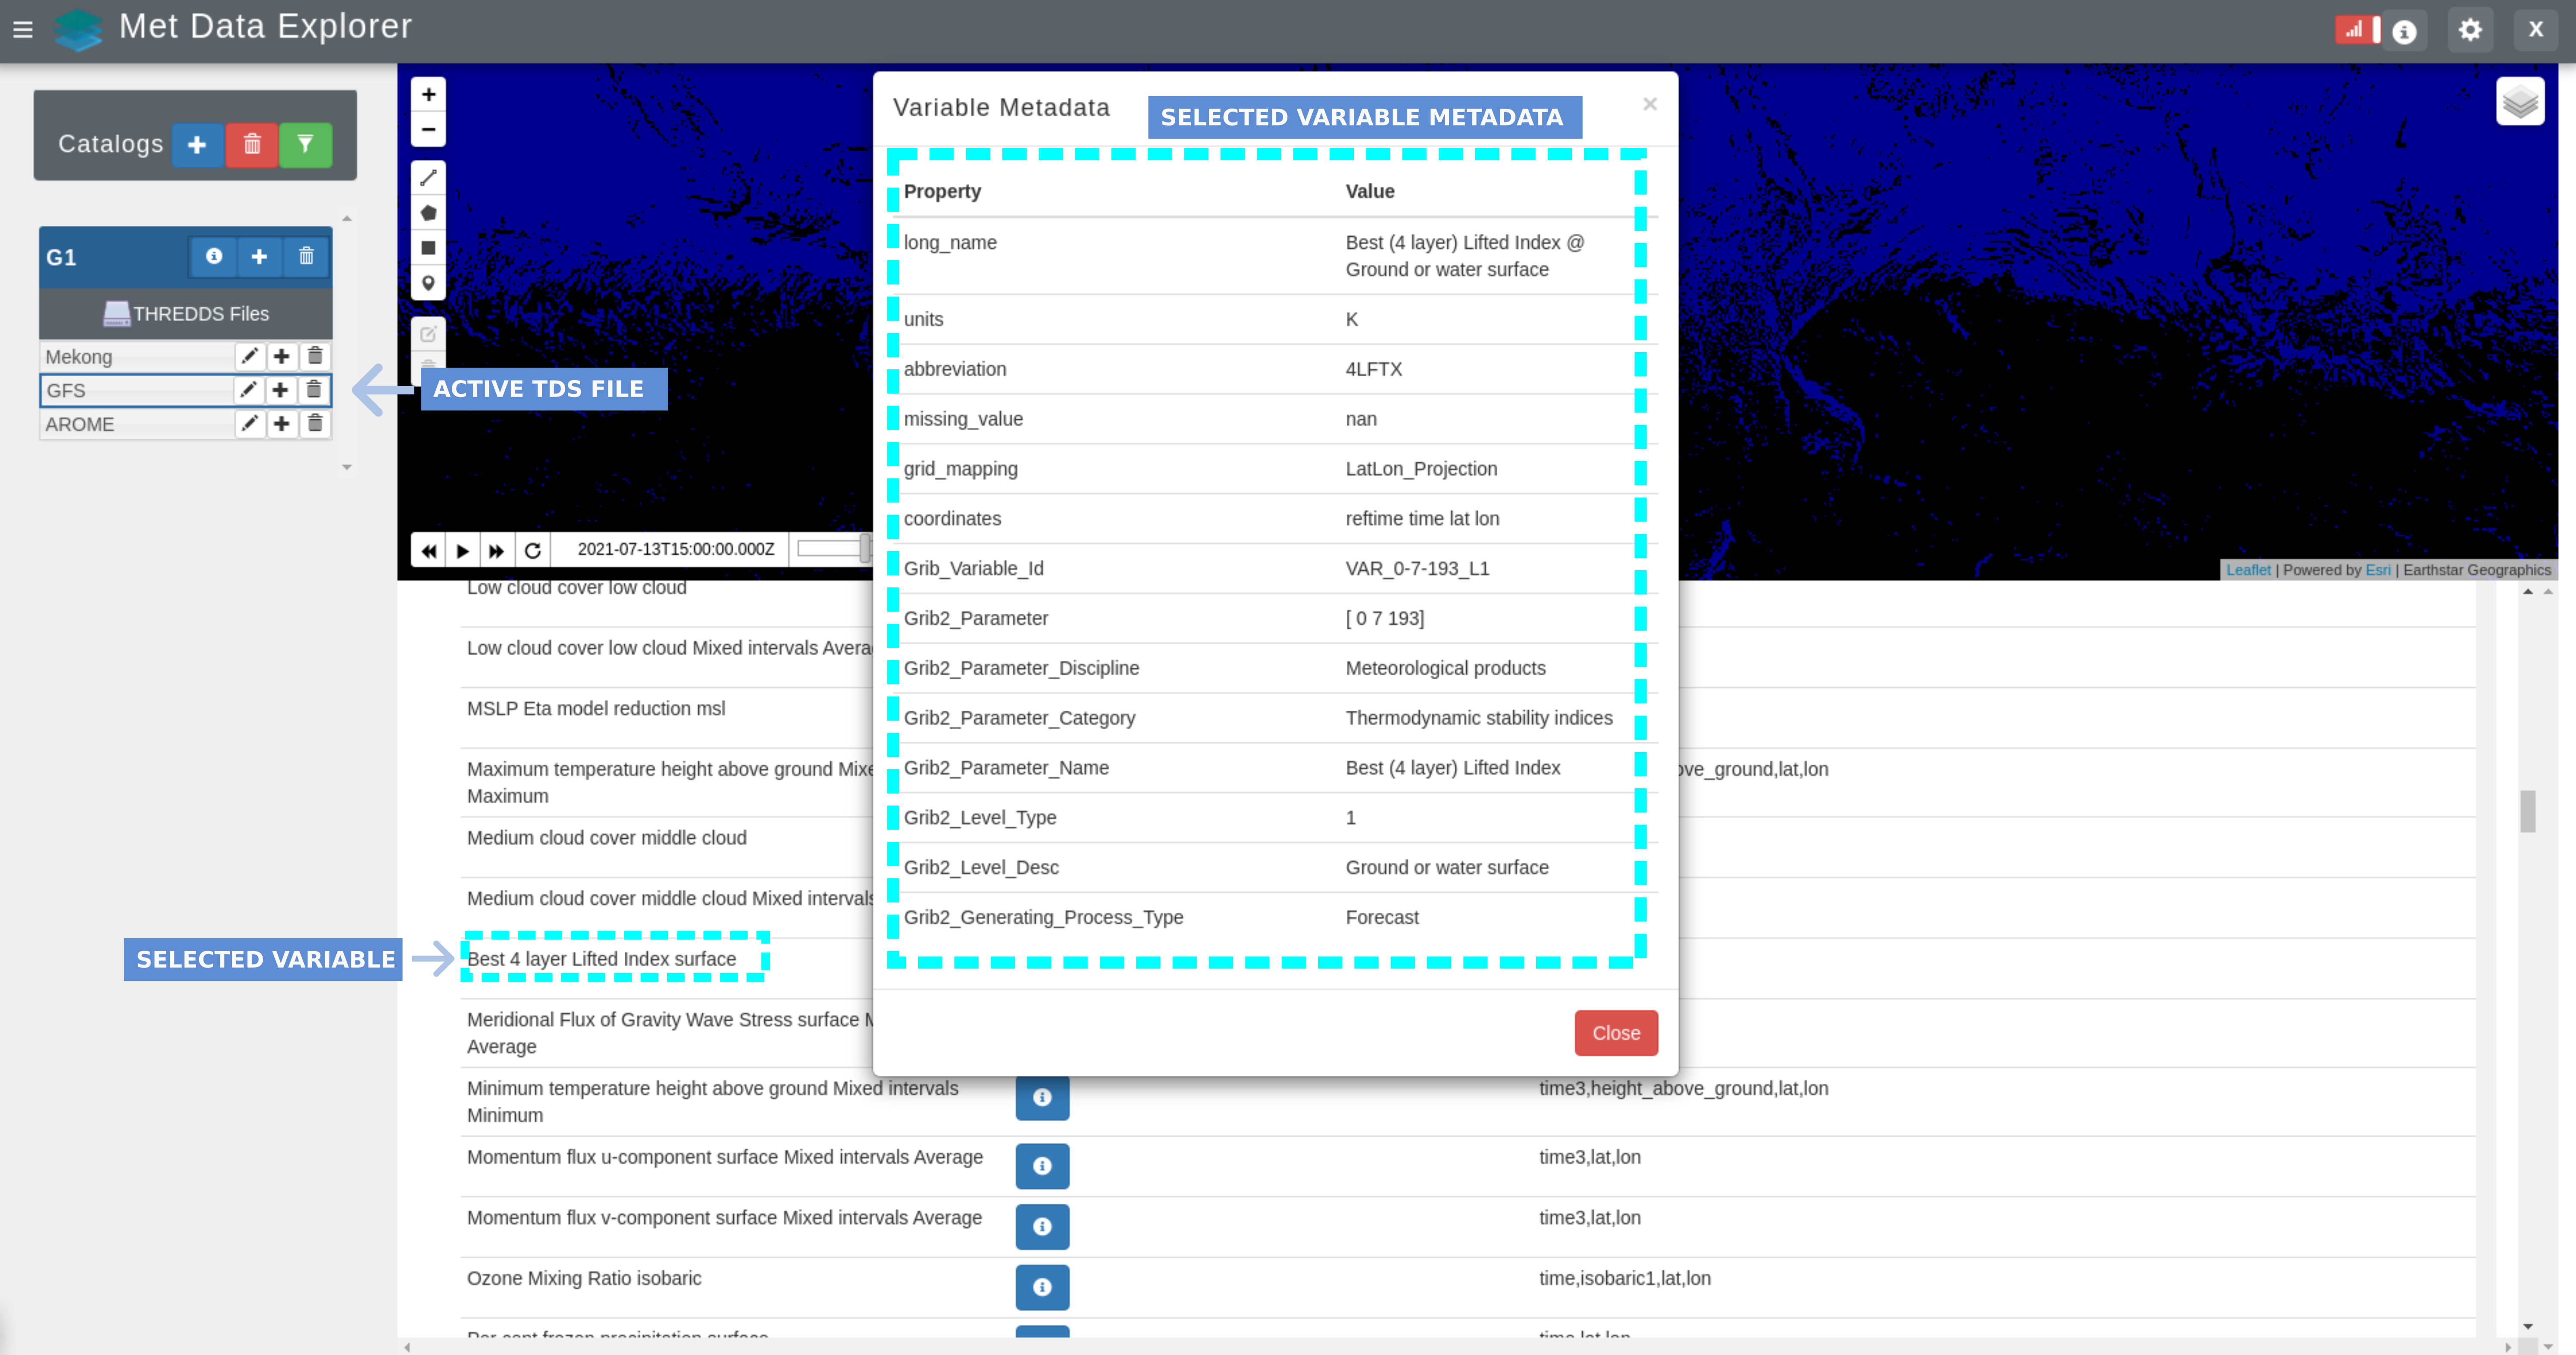
To see the metadata of the selected TDS file from the TDS file variable list, the user should use the
icon. A table displaying the metadata properties of the selected TDS file is generated.
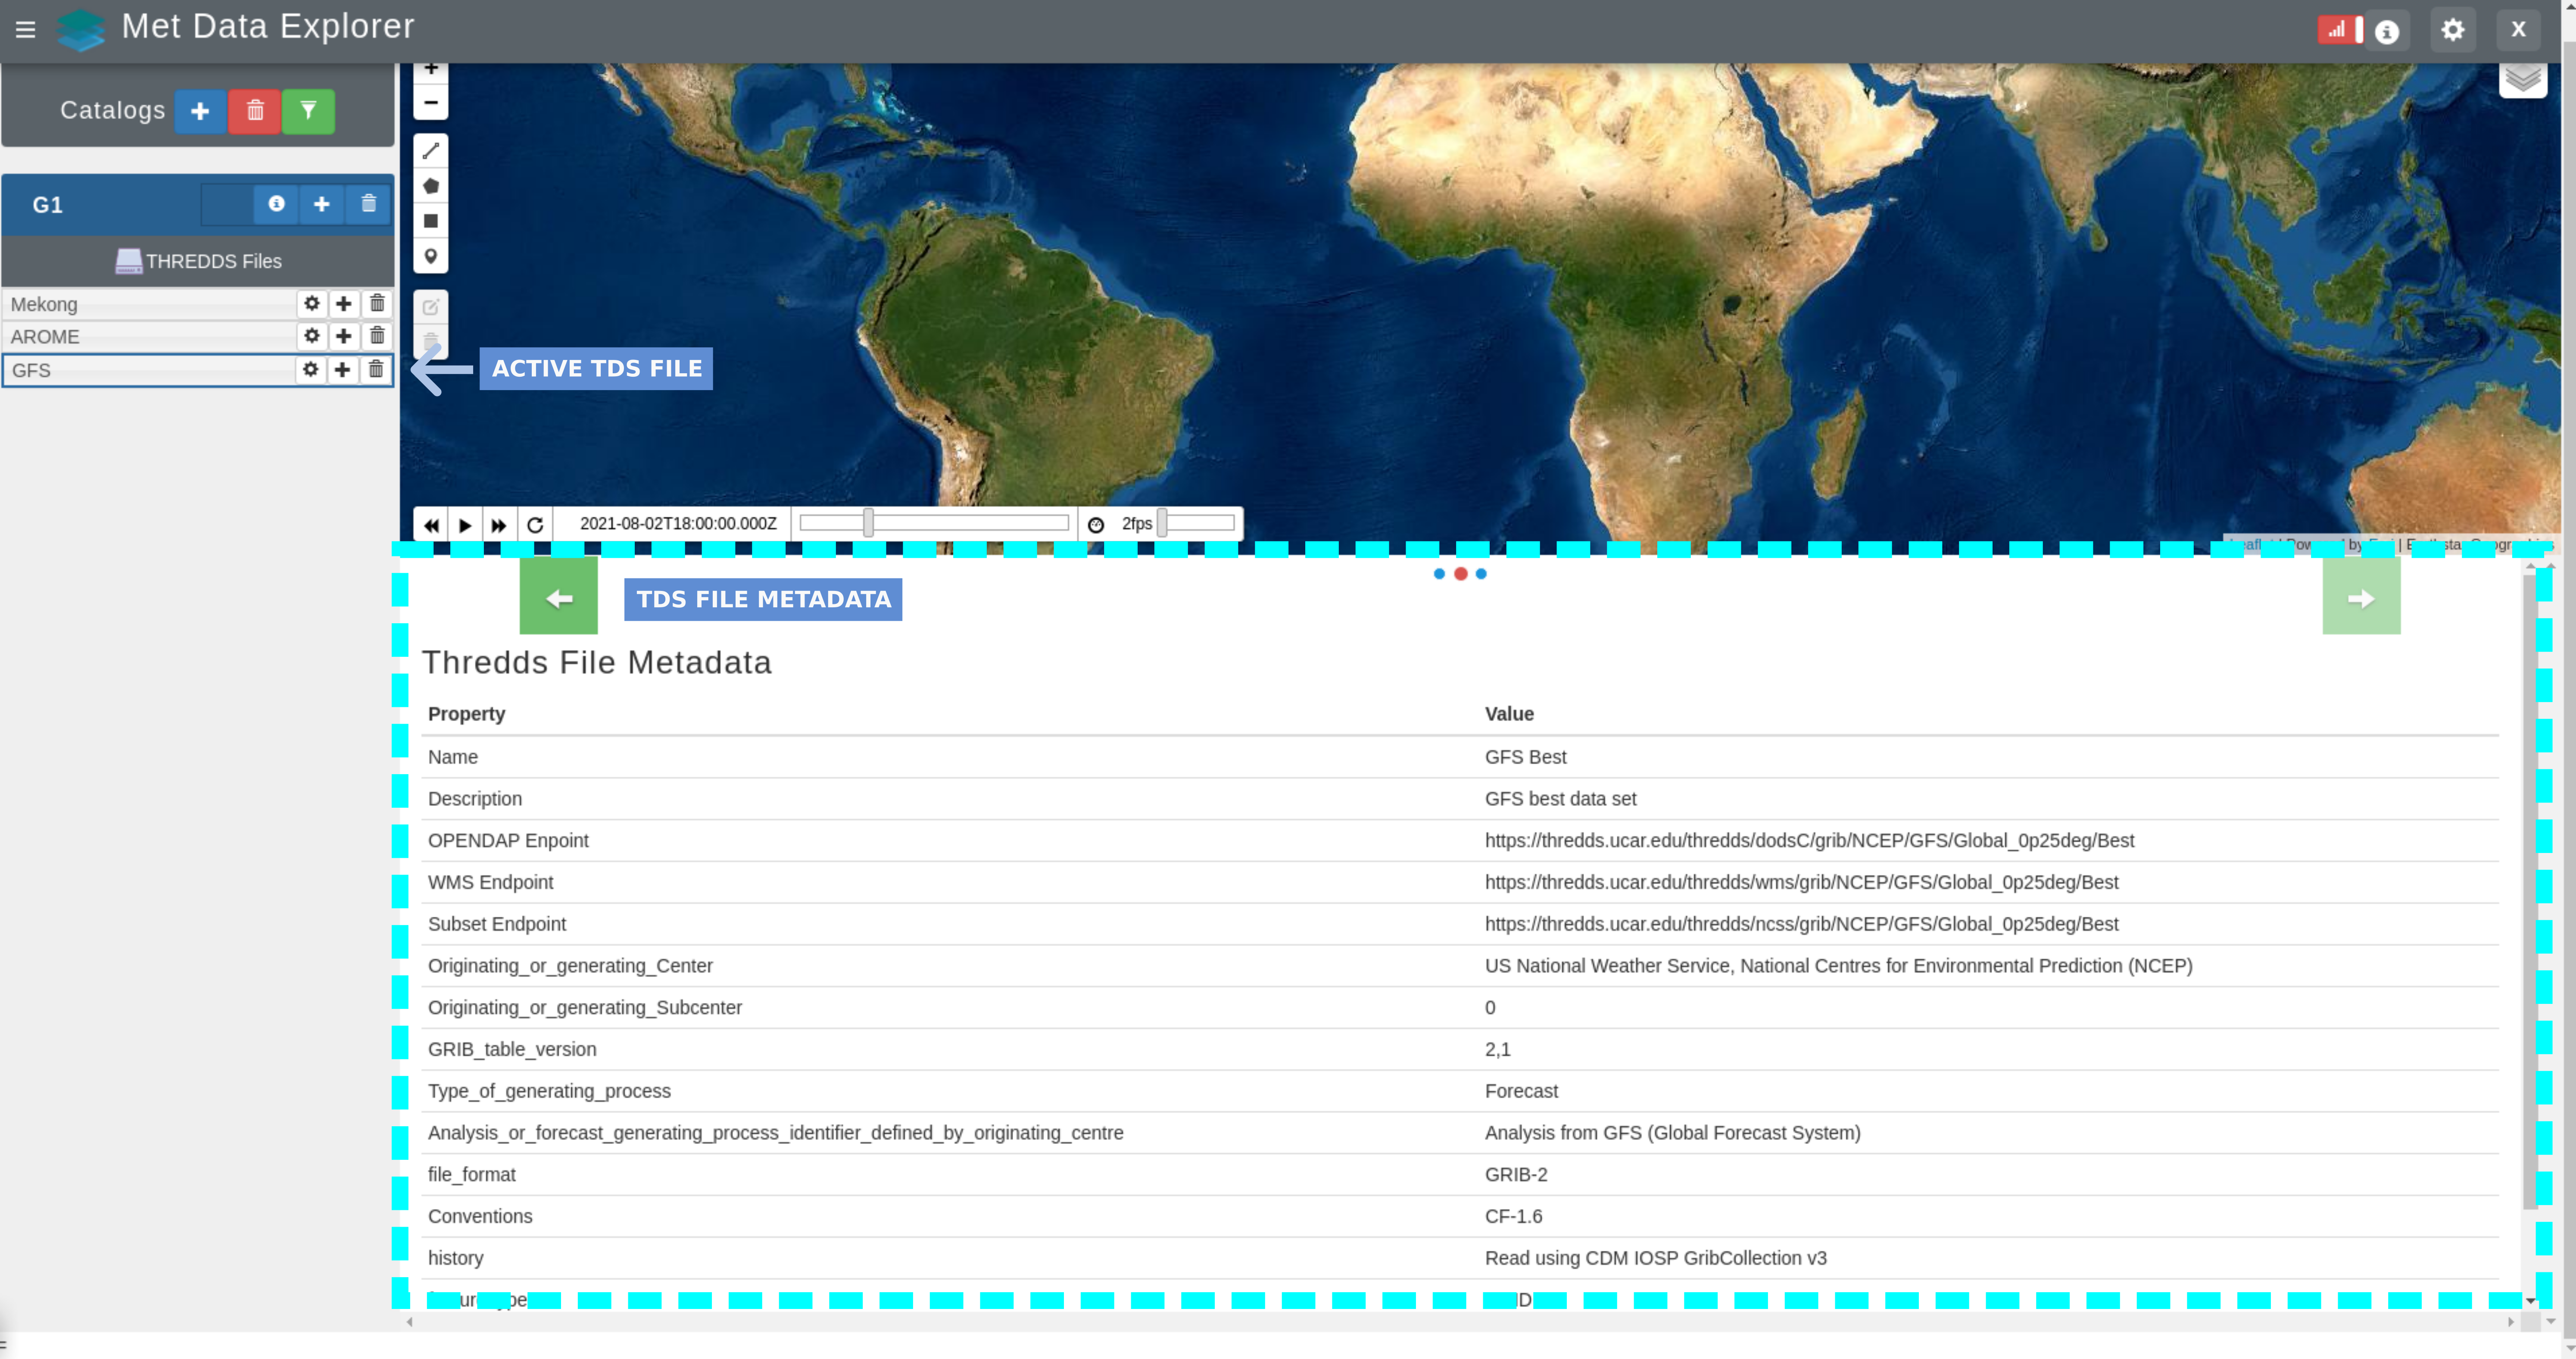
Note
The metadata properties for each TDS file are different and depends on the data source provider.
2.2. Data Analysis
MDE application uses a python package called “grids”. The grids package allows for extracting time series subsets from n-dimensional arrays in NetCDF, GRIB, HDF, and GeoTIFF formats. Time series can be extracted for:
Points - by specifying the coordinates of the point in terms of the dimensions of the array
Ranges or Bounding Boxes - by specifying the minimum and maximum coordinates for each dimension
Spatial data - if the rasters are spatial data and the appropriate dimensions are specified
Masks - any irregularly shaped subset of the array which you can create a binary mask array for
Statistical summaries - of the entire array
Users can open a Python notebook demo and documentation for the grids package here
2.3. Time Series Visualization and Downloading
To visualize and download time series available for a specific TDS file variable, the user should select the variable of interest on the WDE map interface. There are three different methods to retrieve timeseries from a selected variable: “Drawing on map” and “adding a shape feature” such as a shapefile or WMF GeoServer link.
Note
Only time series from variables with 3 dimensions can be plotted using a shapefile and WMF GeoServer link. If a variable contains more than 3 dimensions the “Drawing on a map” method should be selected. Timeseries using a marker or bounding box are supported for variables with more than 3 dimensions.
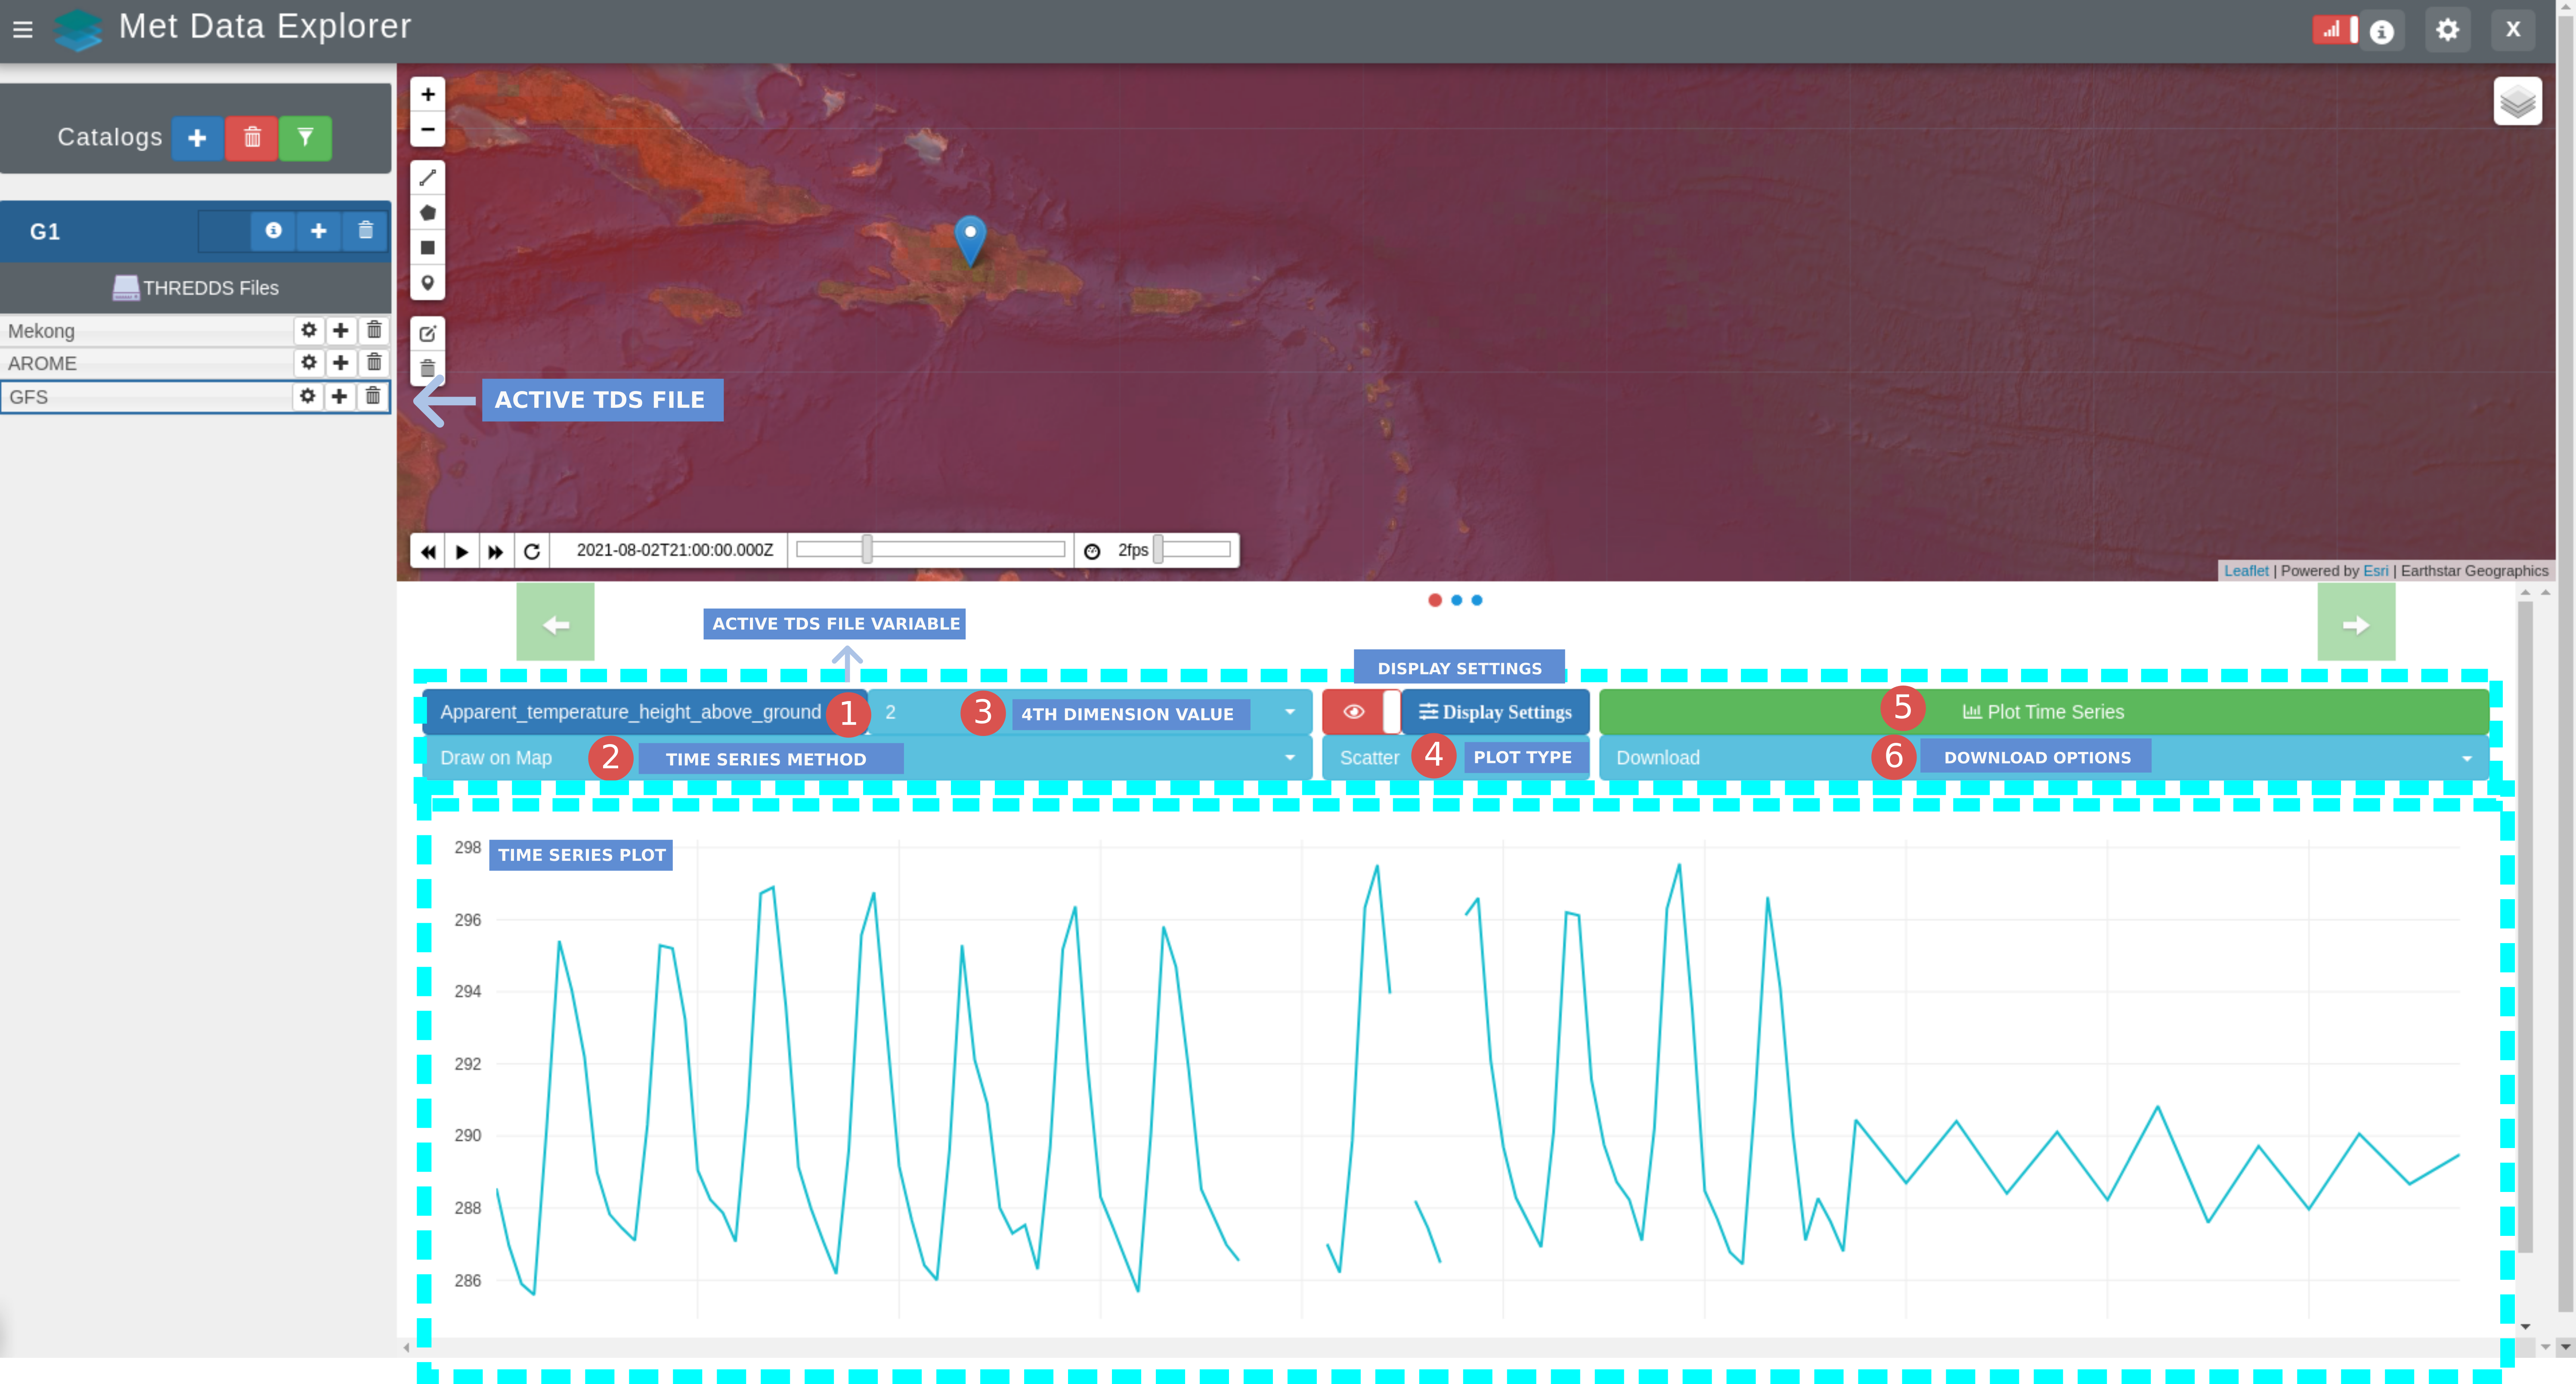
2.3.1. Draw on the Map
The “Draw on map” options allows the user to draw a point, bounding box and polygon in the map using the drawing palette in the map.
The steps to retrieve Time series using the “Draw on Map” method are the following:
Select the variable of interest.
Select the option “Draw on Map”.
If the variable has more than 3 dimensions, then provide a value for the 4th dimension.
Select the type of plots.
Plot the time series.
Download in the desired format.
Note
The 4th dimension is other than time, latitude or longitude. The different values r value for the 4th dimension are found by the MDE automatically. The value for the 4th dimension can be found manually by opening the OPeNDAP service in your browser and looking for the name of the variable. For example, a dimension called isobaric will be listed in the OPeNDAP service in the following way: isobaric1: Array of 32 bit Reals [isobaric1 = 0..40]. This means that the value of the 4th dimension can be any between 0 to 40.
2.3.2. Adding a Shape Feature
The “Adding a Shape Feature” option allows the user to upload a shape feature from a shapefile or WMF GeoServer link in the map and extract time series from a property that is in all the features of the shapefile. For example, if every feature of a shapefile contains a property called “id”, then a time serie for each feature will be retrieved.
Note
Before adding a shape feature, the shapefile or WMF GeoServer service used must have an attribute shared by each feature with unique values. The app will use this attribute to label the features when a time series is extracted.
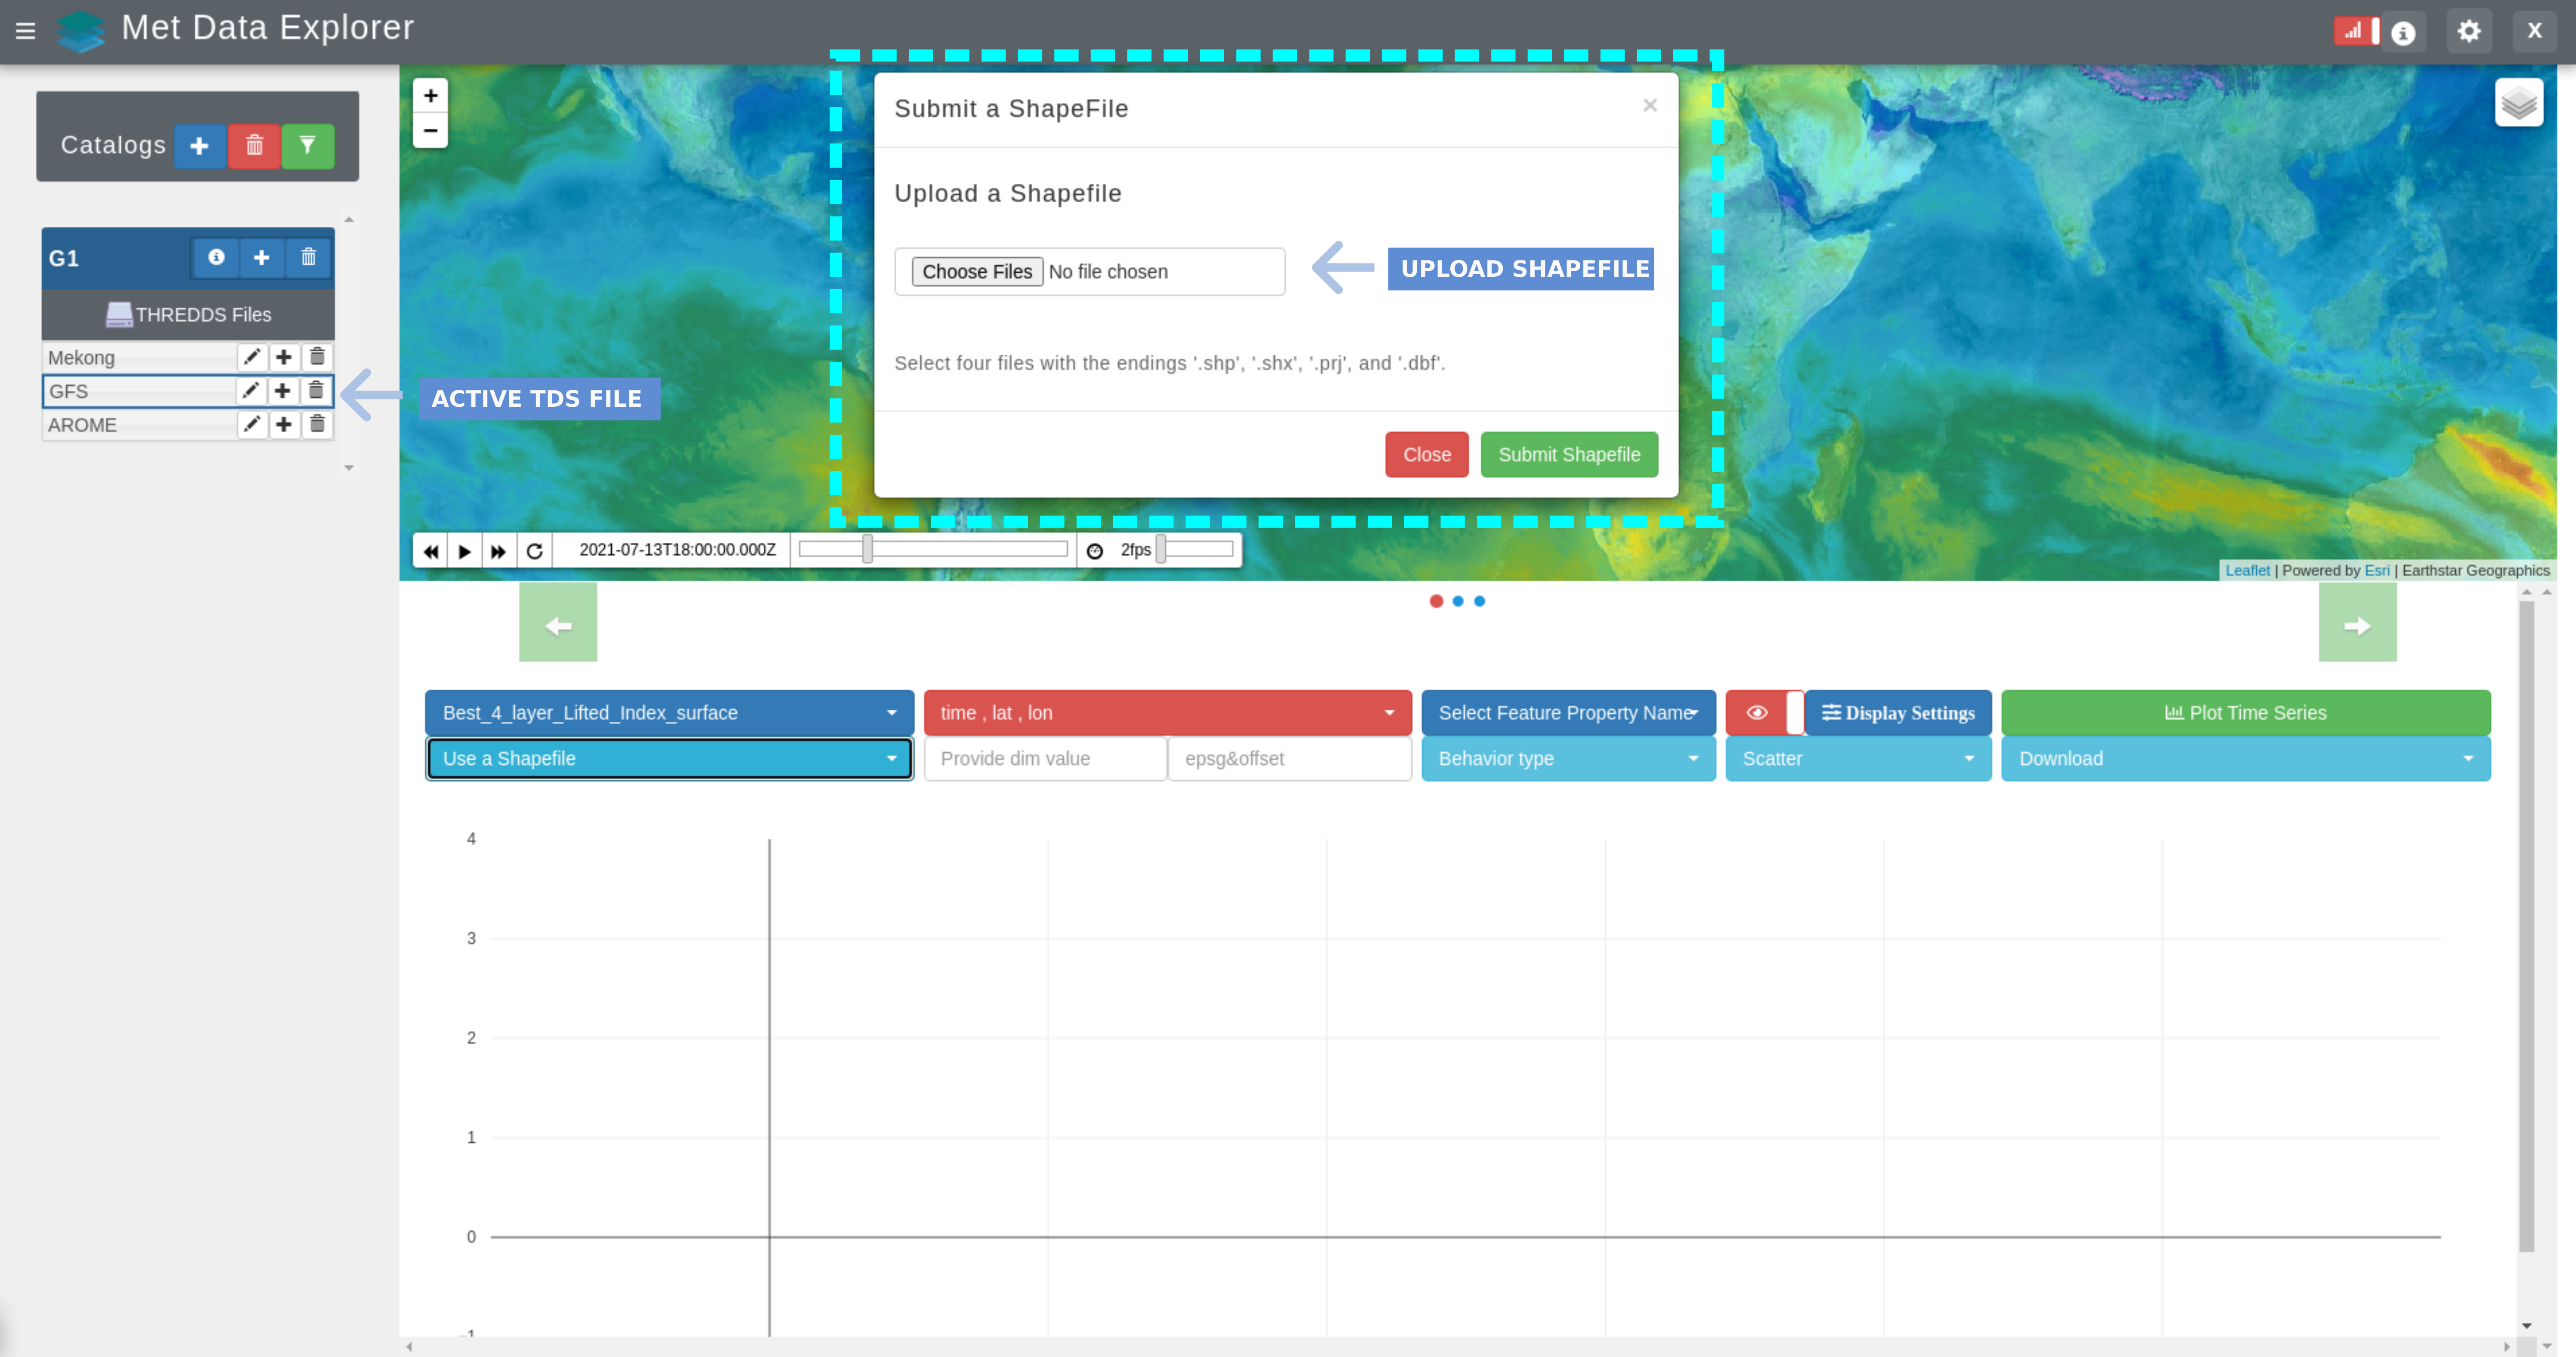
The first option is to upload a shapefile which will be converted and stored as a geojson in the app. When this option is selected, a dialogue box will appear allowing you to select a shapefile from your desktop.
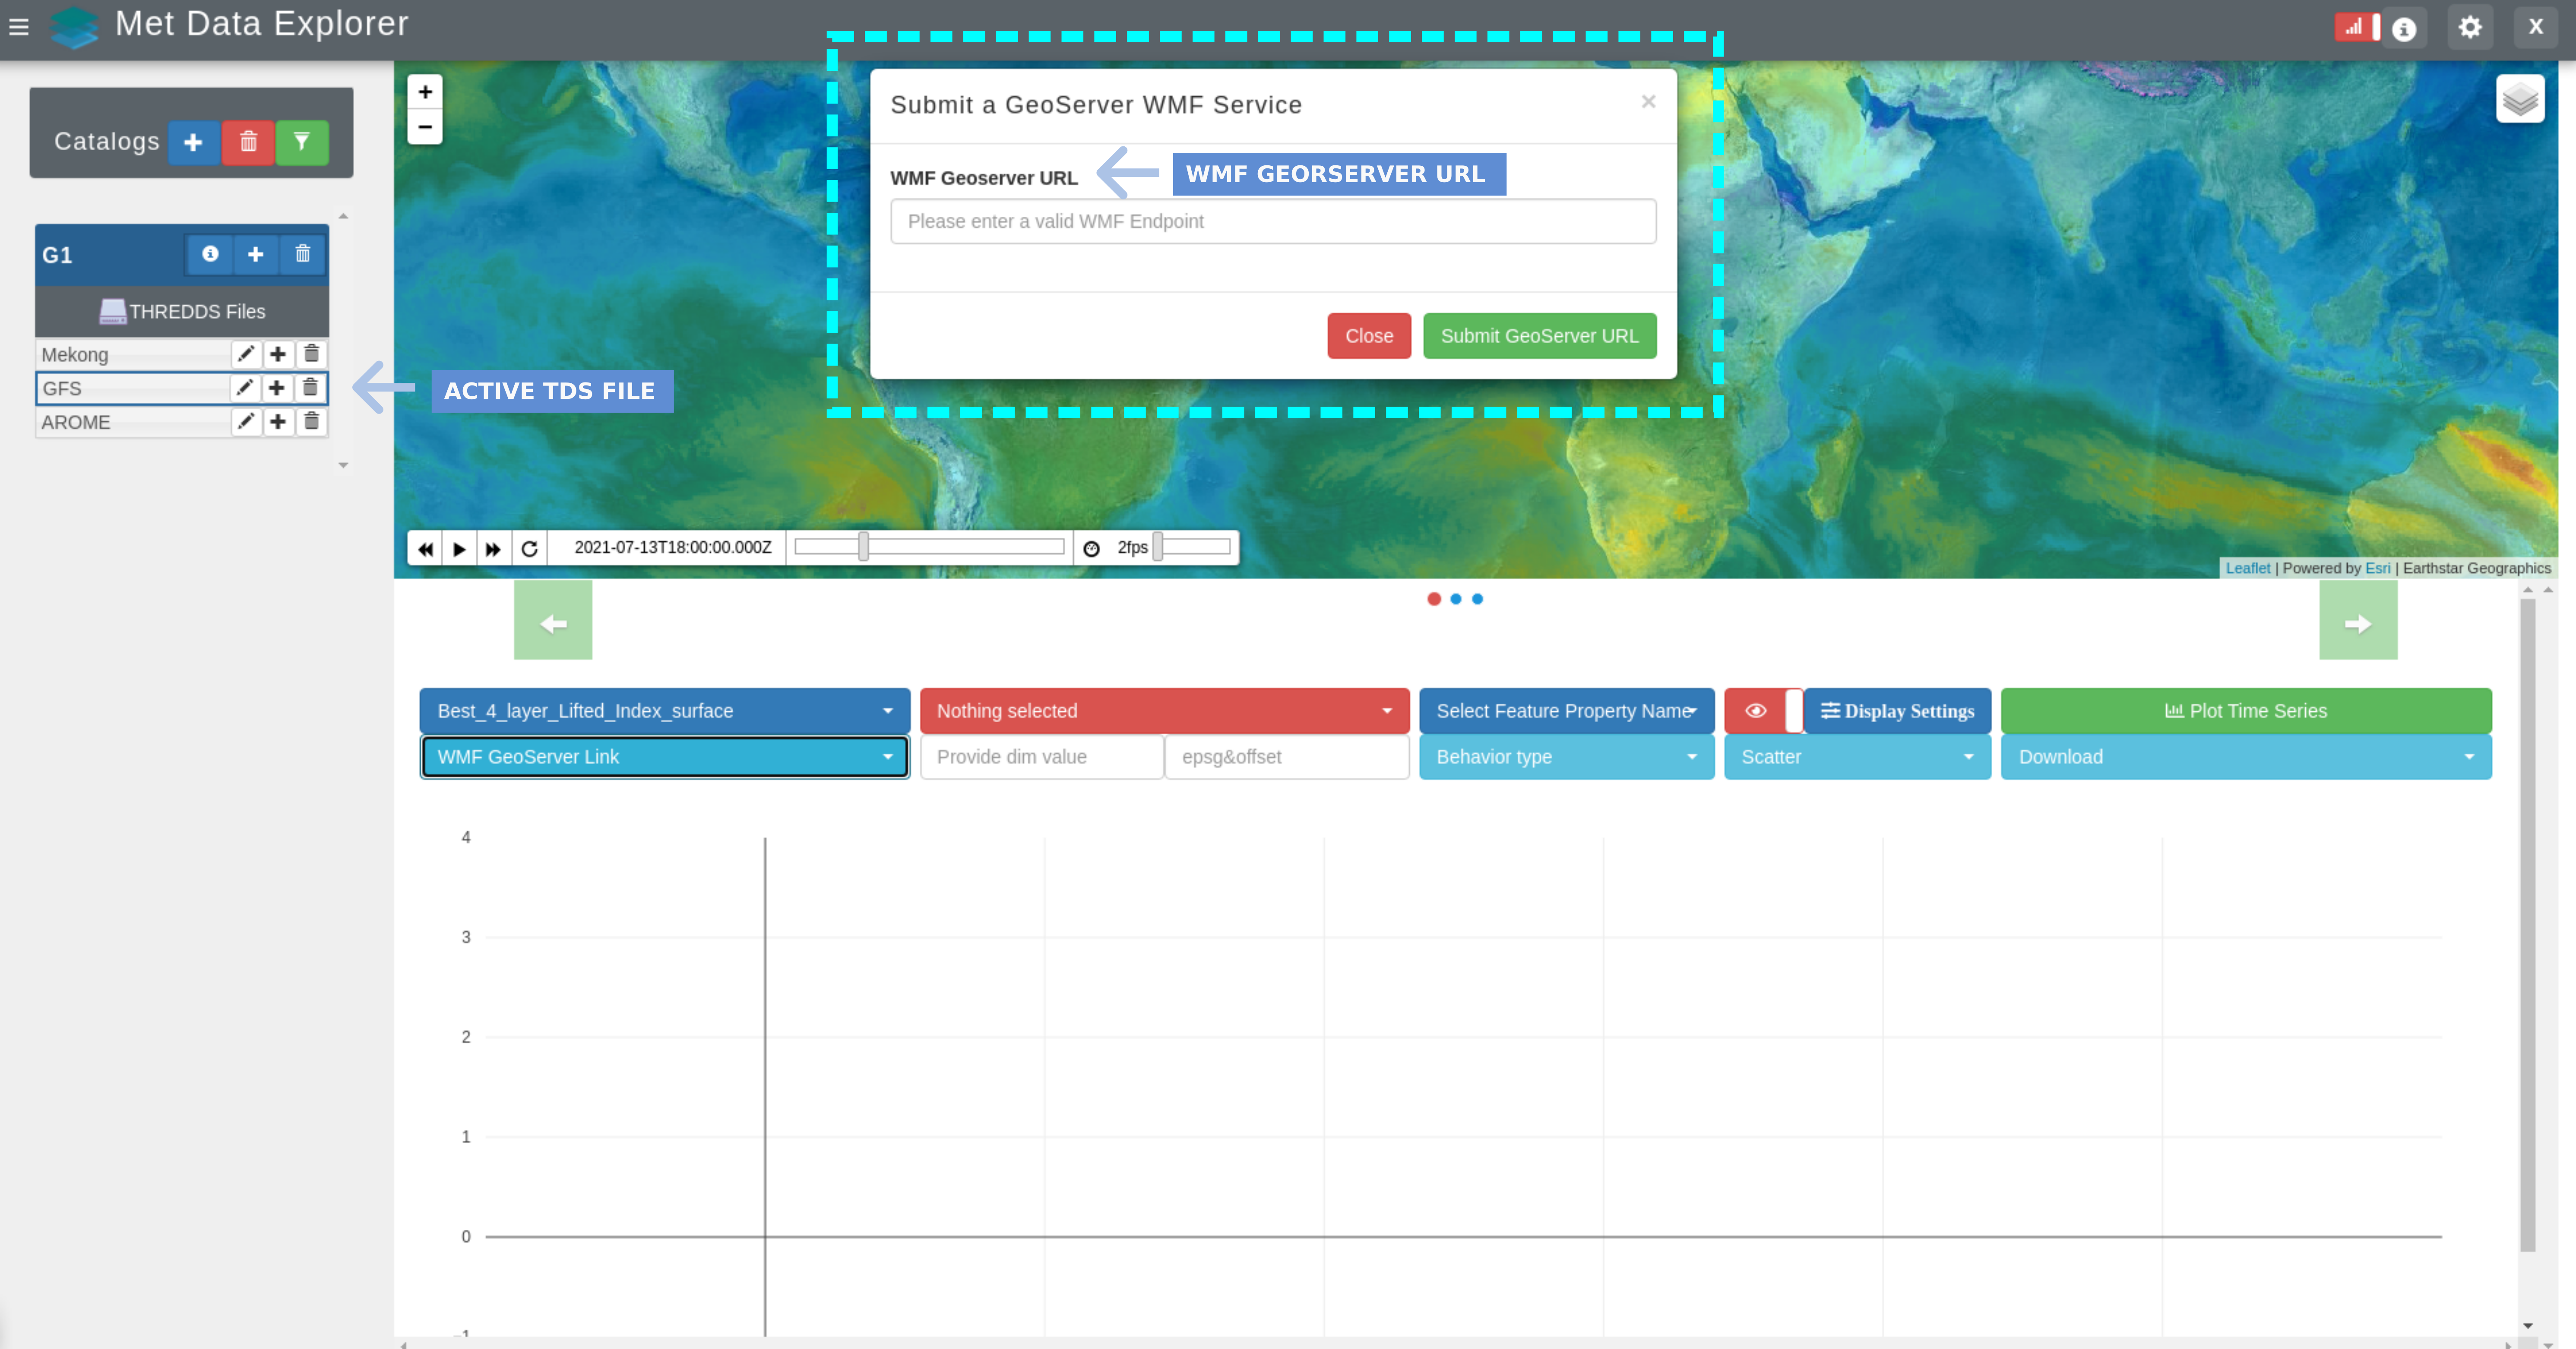
The second option is to access a geojson feature through a Geoserver or other application that provides WFS (Web Feature Service) access. When selected a dialogue box with an input box to enter the WFS service URL will appear. Any other properly formatted WFS URL can be pasted.
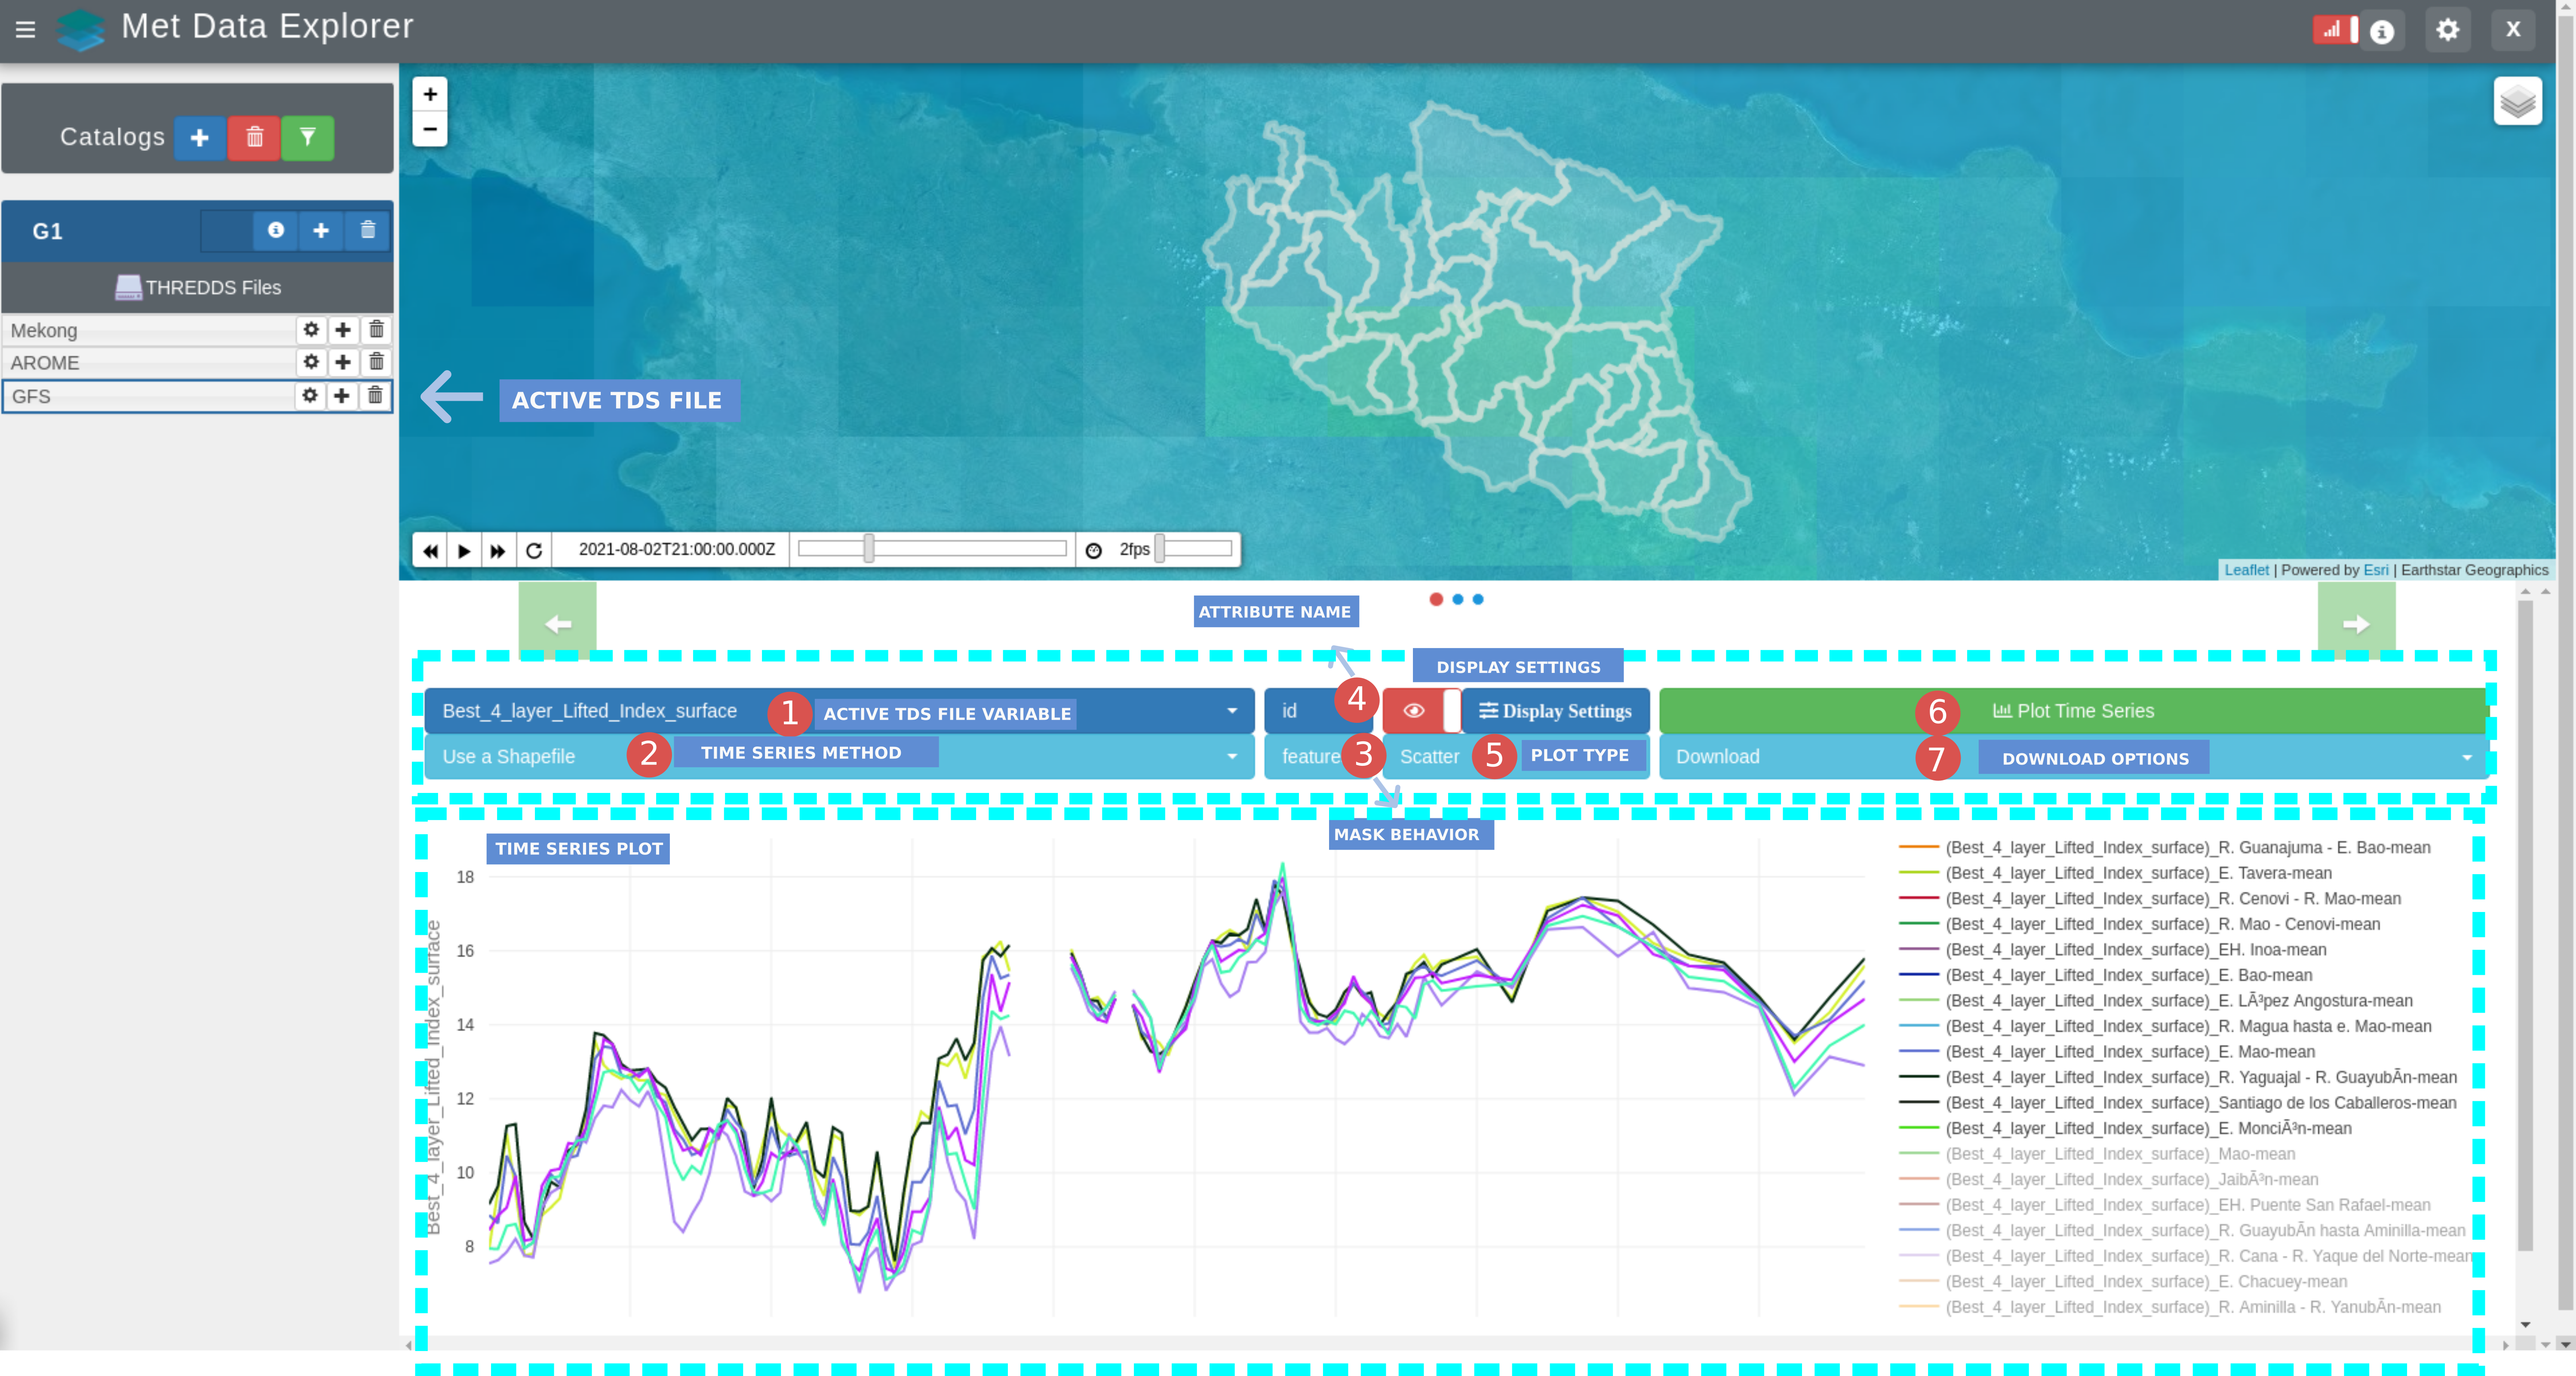
The steps to retrieve Time series using the “Adding a Shape Feature” method are the following:
Select the variable of interest.
Select between the options: “Use a Shapefile” or “WMF GeoServer Link”.
Upload the shapefile or provide the WMF service URL.
Provide the behavior type: dissolve or features.
If you select the “features” type for the behavior type, then select an attribute shared by each feature in the shapefile or WMF service URL that contains unique values.
Select the type of plots.
Plot the time series.
Note
The behavior type determines how the vector data is used to mask the arrays. Options are: dissolve, features - dissolve: treats all features as if they were 1 feature and masks the entire set of polygons in 1 grid - features: treats each feature as a separate entity, must specify an attribute shared by each feature with unique values for each feature used to label the resulting series